
Figure 5.
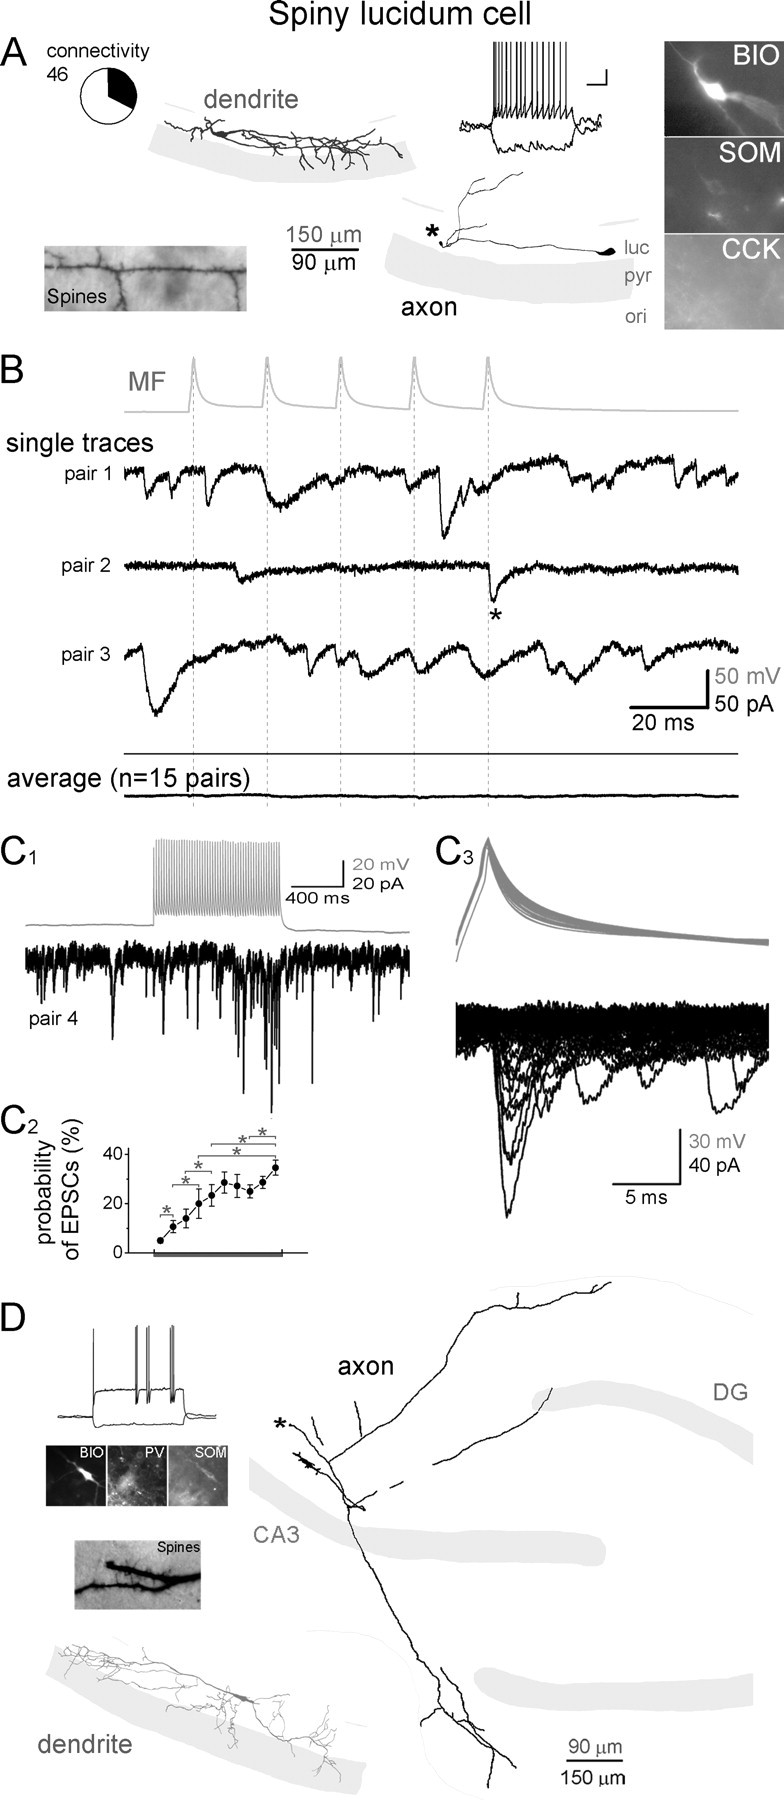
MFs are monosynaptically connected to SLCs in CA3. A, Dendritic (gray) and axonal (black) arborizations, firing pattern, the spiny dendritic surface, and immunoreactivities of a representative SLC that received monosynaptic MF inputs. Note that the SLC dendrites aligned with the stratum lucidum. Asterisk marks the severed main (presumably long distance-projecting) axon of the SLC on the surface of the slice. Circle graph indicates the relative proportion of the SLCs (shaded black in the circle graph) that received monosynaptic input from MFs of the 46 MF–SLC pairs (BIO, biocytin; ori, stratum oriens; pyr, stratum pyramidale; luc, stratum lucidum) (calibration for the firing pattern: 20 mV, 200 ms). B, Top (gray), Average action potential trace from a MF that was monosynaptically connected to a SLC. Middle traces (black), Representative single traces from three SLCs that received monosynaptic inputs from MFs. Bottom (black), Average MF-evoked responses from all SLCs that received monosynaptic MF inputs (see C) (the average of the average responses from all 15 connected pairs is shown). Dashed lines indicate the peak of presynaptic action potentials and asterisks mark monosynaptic events in SLCs. Note the relatively frequent spontaneous events on the single traces. C, Synaptic connections from MFs could be observed in SLCs, mostly only during long trains of presynaptic stimulation because of low initial transmission probabilities. C1, Postsynaptic trace in a SLC in response to stimulation of presynaptic MF with 50 action potentials at 50 Hz. C2, Probability of monosynaptic EPSCs in SLCs (n = 15) during long presynaptic MF trains (plot aligned with presynaptic action potentials on the top in C1; same frequency and number of action potentials as in sample trace). Asterisks mark significant differences (paired Wilcoxon test; p < 0.05 or smaller). C3, Superimposed presynaptic action potentials (top) and postsynaptic responses (bottom). Note the change in the width of the action potentials characteristic for MFs and the variability of the amplitude of the evoked events. D, An example SLC that projected from the CA3 to the DG. Note that the main axon exited the surface of the slice (asterisk).