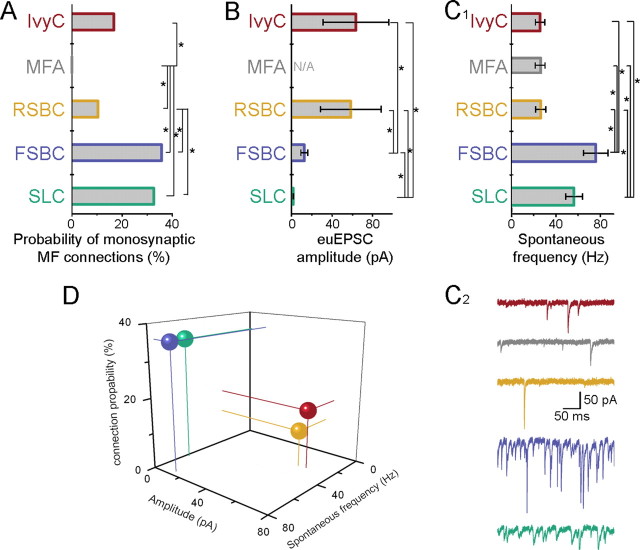
Figure 7.
Cell type-specific correlations between the anatomical and physiological properties of MF inputs to CA3 GABAergic cells. A, Percentage of monosynaptically connected MF–GABAergic cell pairs (asterisks mark significant differences, Fisher exact test; for p values, see Results) (color code applies through A–D). B, Average amplitudes of euEPSCs (including failures) evoked by the first presynaptic spike from all cells receiving monosynaptic MF inputs (n = 5, 0, 3, 5, and 15, respectively). Asterisks mark significant differences (Mann–Whitney nonparametric U test; for p values, see legend to Table 1). C1, Average spontaneous event frequencies in the five different cell types (n = 11 from each). Asterisks mark significant differences (Mann–Whitney nonparametric U test; for p values, see Results). C2, Example traces illustrating cell type-specific differences in spontaneous event frequencies. D, Three-dimensional representation of the relative number and euEPSC amplitude of MF inputs and frequency of spontaneous synaptic events in four different CA3 GABAergic cells (spheres indicate the average values for each cell type; thin lines projecting to zero values are also included for better visualization of the relative positions of the spheres) (blue, FSBC; green, SLC; yellow, RSBC; red, IvyC).

