Figure 3.
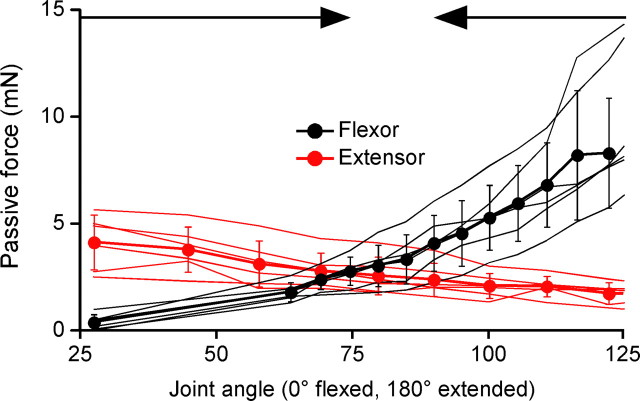
Isolated stick insect femur–tibia joint muscles develop large passive forces that are approximately equal at the rest joint angles observed in intact legs. Flexor (black) and extensor (red) static passive length-tension curves (N = 6 for each muscle) overlap at the same angle range that intact legs return to after perturbation (Fig. 2A3). Thin lines are data from individual muscles, thick lines with closed circles are mean data, error bars are SDs. Joint angles were calculated from stretched muscle lengths using moment arms measured in Guschlbauer et al. (2007). Arrows at top of panel show the angles (75° and 90°, respectively) that legs with intact muscles drove to after flexion and extension.

