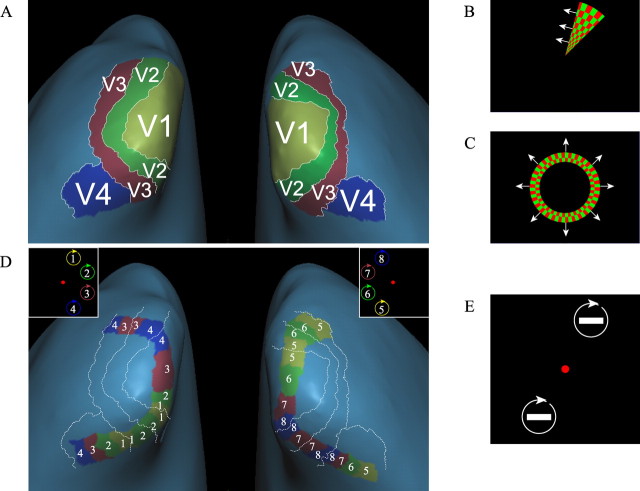
Figure 2.
Delineating regions of interest. First, we mapped V1–V4 (A) by showing a rotating wedge (B) to delineate the boundaries between areas and an expanding and contracting annulus (C) to delineate eccentricity boundaries of specific areas. Next, we outlined eight retinotopic locations in V1–V4 (D) by showing rotating white rectangles at eight different radial positions, at an eccentricity of 5° of visual angle (E).

