
Figure 4.
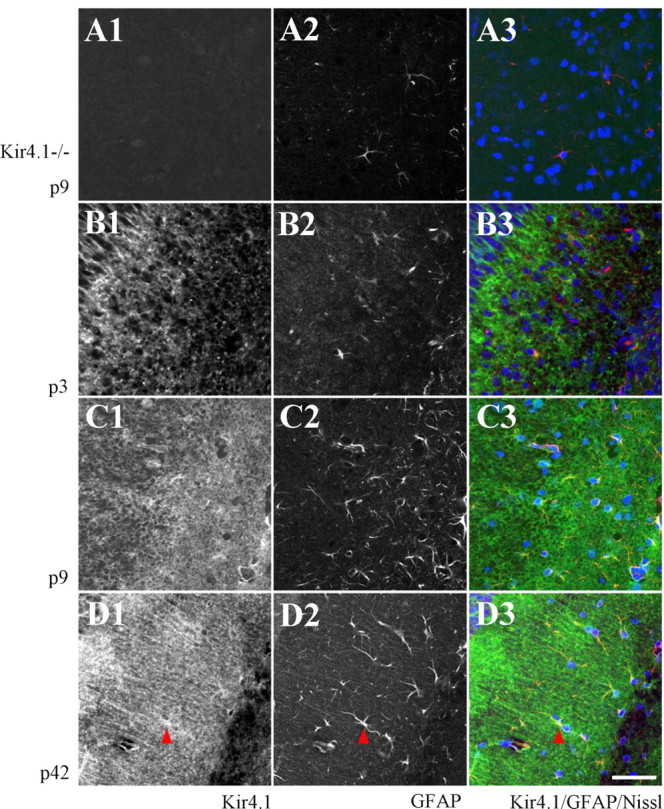
Confocal analysis of colabeling of Kir4.1 and GFAP in strata radiatum and lacunosum-moleculare of the developing CA1 region. A1, Kir4.1 immunoreactivity was absent in Kir4.1−/− mice. A2, GFAP staining in the same section. A3, The merge along with Nissl staining (blue; GFAP is in red). B–D, Kir4.1 immunoreactivity (B1, C1, D1), GFAP staining (B2, C2, D2), and the merge along with Nissl counterstaining (B3, C3, D3) at P3, P9, and P42 as indicated (Kir4.1, green). Red arrowheads (D) indicate colocalization of Kir4.1 and GFAP. Scale bar, 50 μm. In the top left, part of the pyramidal layer is visible.