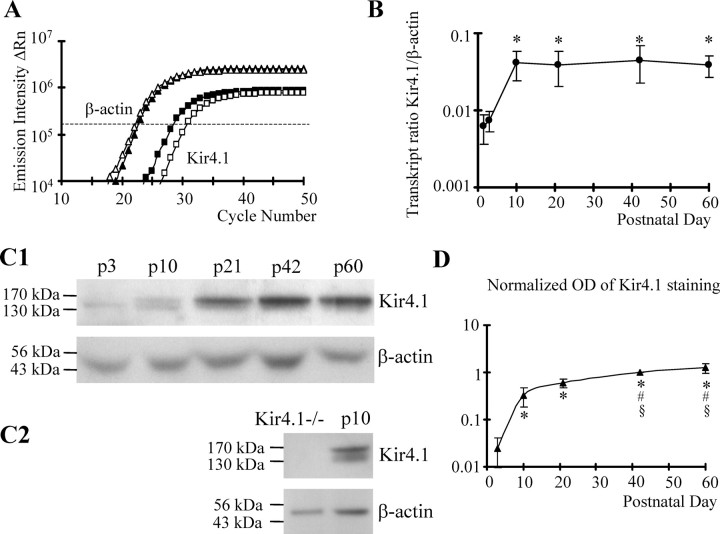
Figure 5.
Developmental regulation of Kir4.1 mRNA and protein in the CA1 region. A, Amplification plots for Kir4.1 (squares) and β-actin (triangles) of two mRNA samples were obtained using real-time sqRT-PCR. mRNA was analyzed from mice at P3 (open symbols) and P21 (filled symbols). The difference in threshold cycles (ΔRn; taken at the dashed line) at P3 was larger than that at P21. B, The corresponding gene expression ratio, Kir4.1/β-actin, was determined according to Equation 5 and blotted against age. Mean and SD were obtained at P1 and P3 (12 samples each) and at P10, P21, P42, and P60 (10 samples each). The increase in Kir4.1 expression between P1 or P3 and the other time points was significant (*). C1, Roentgen films of Western blot analysis of Kir4.1 tetramers (∼160 kDa) and β-actin (42 kDa). Protein content of lysates prepared from whole hippocampi was analyzed at the ages indicated. The β-actin signal served as a loading control (60 μg of protein each). C2, Absence of Kir4.1 protein in Kir4.1−/− mice compared with wild type (P10; β-actin served as a control). D, The optical density (OD) of Kir4.1 tetramer signals was corrected with respect to β-actin for each sample. Subsequently, OD values were normalized to Kir4.1 at P42. The plot shows mean values of six mice. Differences between P3 and P10–P60 (*), P10 and P42–P60 (#), and P21 and P42–P60 (§) were statistically significant.

