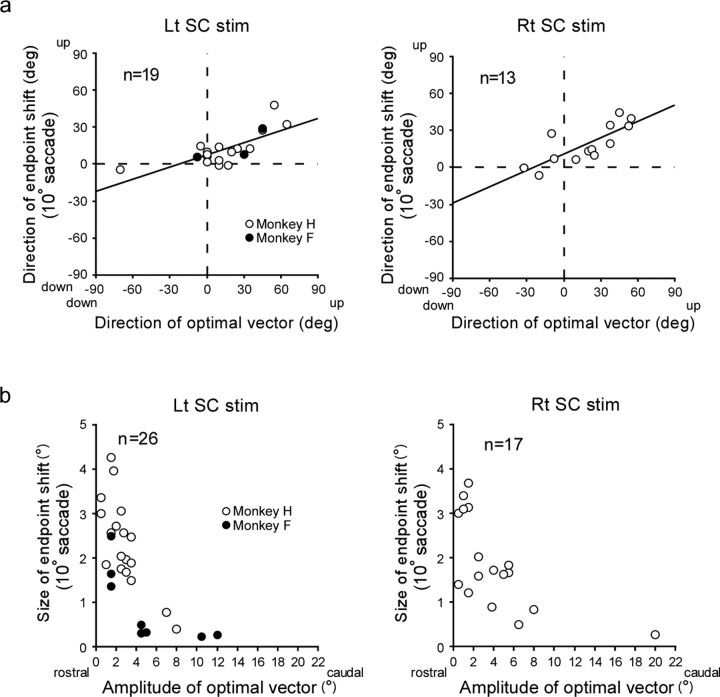
Figure 10.
a, Relationship between the direction of the endpoint shift (ordinate) and that of the optimal vector for SC stimulation site (abscissa) for 32 experiments, shown separately for left SC and right SC stimulation. Note that in this figure and in Figures 11c and 12a, we adopted the average of shift directions for leftward and rightward saccades as the representative value for each of the 11 experiments in the second series. The regression line formula is y = 0.33x + 7.47, p for trend <0.0005 for left SC stimulation, and y = 0.44x + 10.81, p for trend <0.005 for right SC stimulation (simple linear regression). b, Relationship between the size of the endpoint shift (ordinate) and the amplitude of the optimal vector for the SC stimulation site (abscissa) for 43 experiments. Note that in this figure and in Figures 11d and 12b, we adopted the average of shift sizes for leftward and rightward saccades as the representative value for each experiment in the second series. Rt, Rightward; Lt, leftward; “deg” denotes shift direction and direction of optimal vector.

