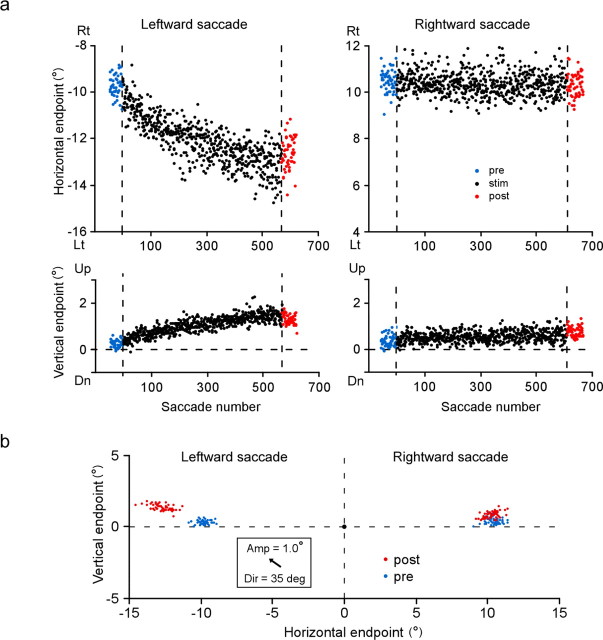
Figure 3.
a, Course of change in saccade endpoints induced by stimulation of the right SC. Same experiment as in Figure 2 (monkey H). Endpoints of individual saccades, expressed relative to location of presaccadic fixation target, are plotted against saccade number. Horizontal positions of saccade target are −10° and 10°. Positive direction of ordinates indicates rightward (Rt) or upward. Blue and red dots indicate saccades in prestimulation and poststimulation sessions, respectively. Vertical broken lines indicate start and end of stimulation session. b, Two-dimensional distribution of saccade endpoint before (blue) and after (red) stimulation session. A black dot at the origin indicates presaccadic position of target. An arrow inside the inset indicates the optimal vector for the stimulation site. Dir, Direction represented by angular deviation from the pure leftward direction; Amp, amplitude; Lt, leftward; Dn, downward; “deg” denotes saccade direction.

