
Figure 4.
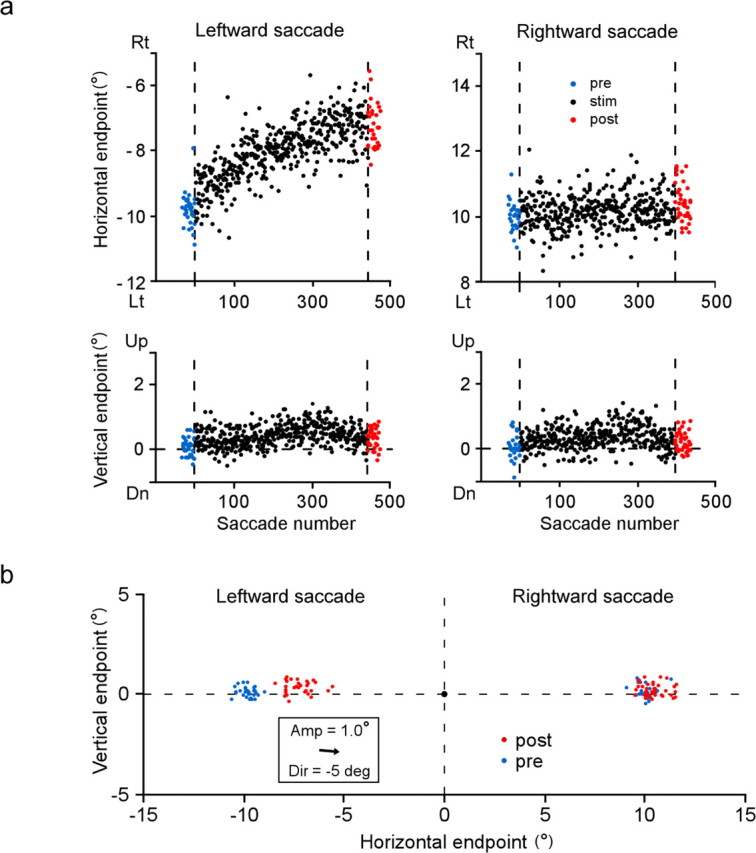
a, Course of endpoint change induced by stimulation of the left SC in monkey F. Same format as in Figure 3a. b, Two-dimensional distribution of saccade endpoints before (blue) and after (red) the stimulation session. Same format as in Figure 3b. Note that the direction of the optimal vector for the stimulation site (Dir) is represented by angular deviation from the pure rightward direction. Rt, Rightward; Lt, leftward; Dn, downward; “deg” denotes saccade direction.