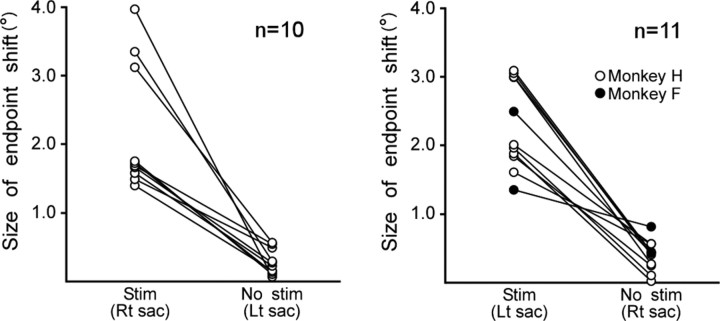
Figure 5.
Comparison of the size of endpoint shift between stimulation-coupled and noncoupled saccades. Data are from 21 experiments in which saccades in one horizontal direction were coupled with stimulation. Left (right) panel shows experiments in which leftward (rightward) saccades were coupled with SC stimulation. Ordinates indicate the size of the endpoint shift calculated from the square root of the horizontal and vertical changes in the saccade endpoint. In each panel, two groups of circles aligned vertically indicate stimulation-coupled saccades and noncoupled saccades. A pair of circles connected by a line indicates data from the same experiment. Rt, Rightward; Lt, leftward.

