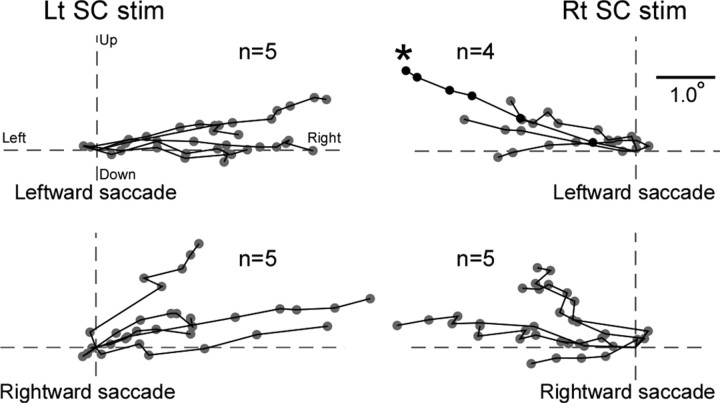
Figure 6.
Course of the endpoint shift represented two-dimensionally. A summary of the 19 experiments in monkey H, shown separately in four panels according to stimulation side and saccade direction. Dots connected with lines indicate one experiment. Each dot indicates the average for 25 consecutive saccades, starting from the first, 100th, 200th, and so on. An asterisk indicates data shown in Figures 2 and 3. The intersection of two broken lines indicates the average endpoint in the prestimulation session. Rt, Rightward; Lt, leftward.

