
Figure 9.
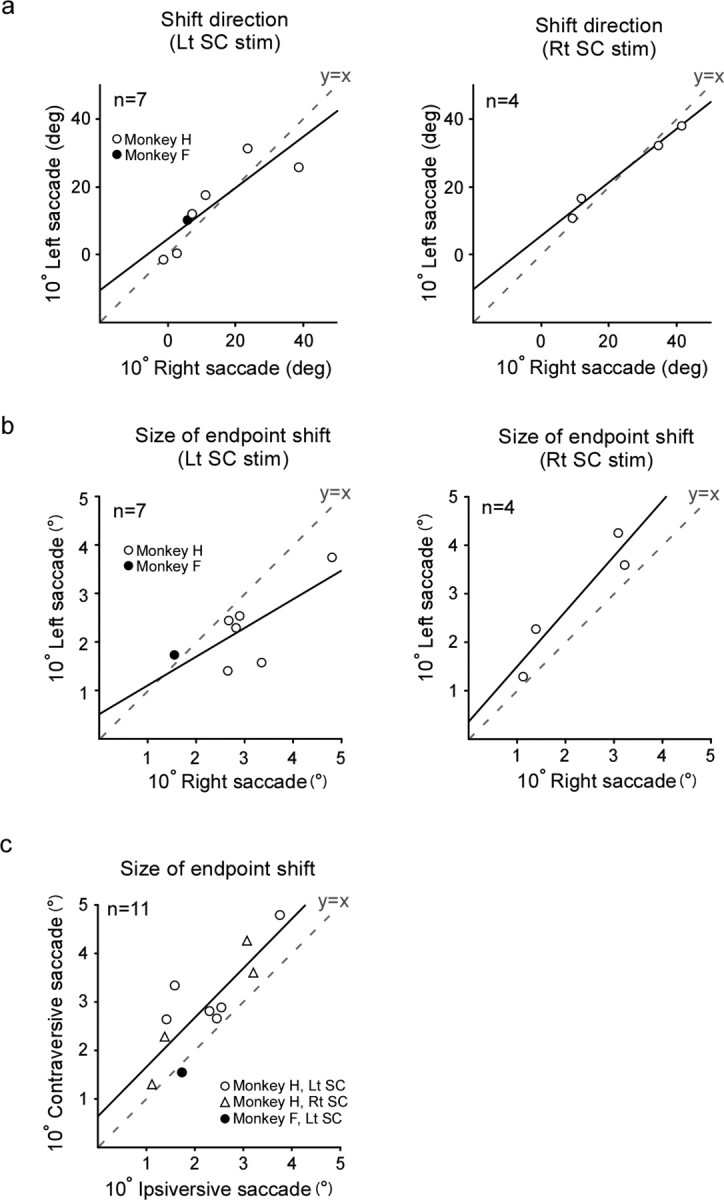
Endpoint shifts elicited in leftward and rightward saccades. Data are from 11 experiments. Open and filled symbols indicate monkeys H and F, respectively. The broken line in each graph indicates y = x. a, Relationship between the direction of the endpoint shift for leftward saccades (ordinate) and that for rightward saccades (abscissa), shown separately for left SC and right SC stimulation. The shift direction is represented by angular deviation from the direction contralateral to the stimulated SC. Zero degrees indicates pure rightward for left SC and pure leftward for right SC. Positive values indicate upward deviation. The regression line formula is y = 0.75x + 4.63, p for trend <0.05 for left SC stimulation, and y = 0.78x + 5.57, p for trend <0.01 for right SC stimulation (simple linear regression). b, Relationship between the size of the endpoint shift for leftward saccades (ordinate) and that for rightward saccades (abscissa). The regression line formula is y = 0.59x – 0.51, p for trend = 0.06 for left SC stimulation, and y = 1.14x + 0.36, p for trend = 0.06 for right SC stimulation (simple linear regression). c, Relationship between the size of the endpoint shift for contraversive saccades (ordinate) and that for ipsiversive saccades (abscissa). Open circles, open triangles, and a filled circle indicate left SC stimulation in monkey H, right SC stimulation in monkey H and left SC stimulation in monkey F, respectively. Rt, Rightward; Lt, leftward; “deg” denotes shift direction.