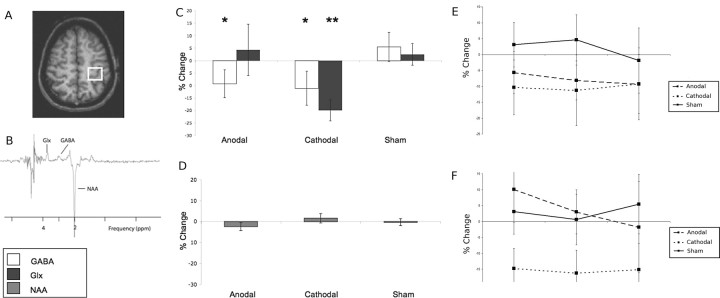
Figure 1.
A, Typical placement of the 2 × 2 × 2 cm voxel within the left sensorimotor cortex. B, GABA optimized 3 T spectrum, showing resonances from NAA, GABA, and Glx. C, Changes in neurotransmitter-to-NAA ratios, given as percentage change from baseline values (mean ± SD). *p < 0.05, **p < 0.01. D, No change in absolute NAA quantification is seen in any stimulus condition. E, F, The decreases seen in both GABA (E) and Glx (F) following stimulation were sustained over the 20 min scanning period.

