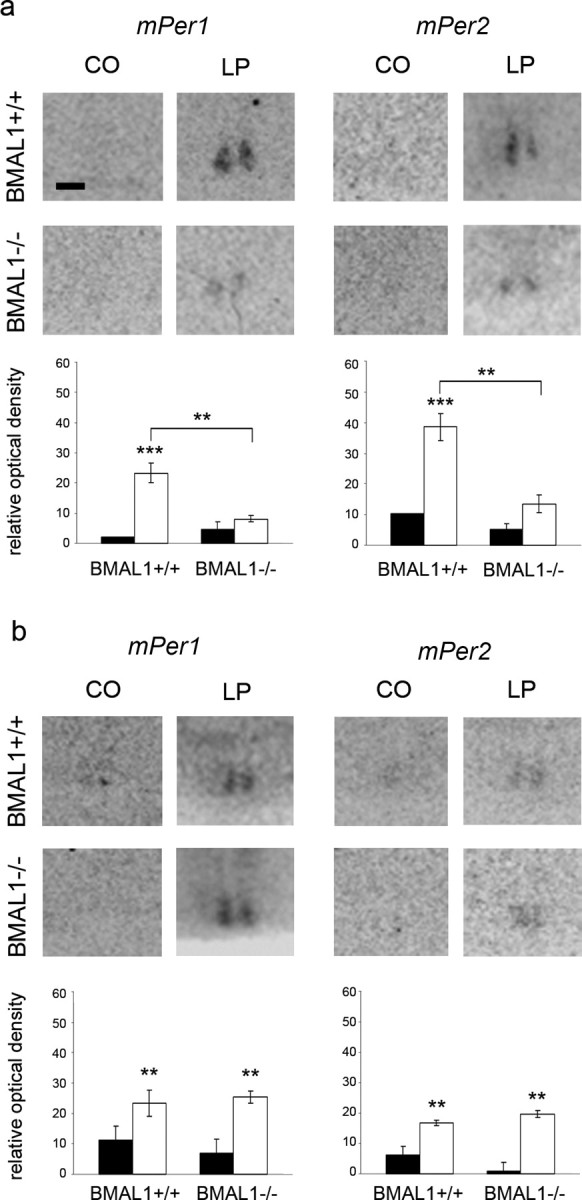
Figure 1.

mPer1 and mPer2 mRNA levels in the SCN of BMAL1+/+ and BMAL1−/− mice 2 h after a 15 min light pulse (LP) or dark control (CO) in the early (ZT14) (a) or the late (ZT22) (b) night determined by in situ hybridization. Top, Representative autoradiographs of the SCN region. Scale bar, 200 μm. Bottom, Black (CO) and white (LP) bars represent mean ± SEM relative optical density of Per in situ hybridization signals within the SCN (n = 5). **p < 0.01; ***p < 0.001.
