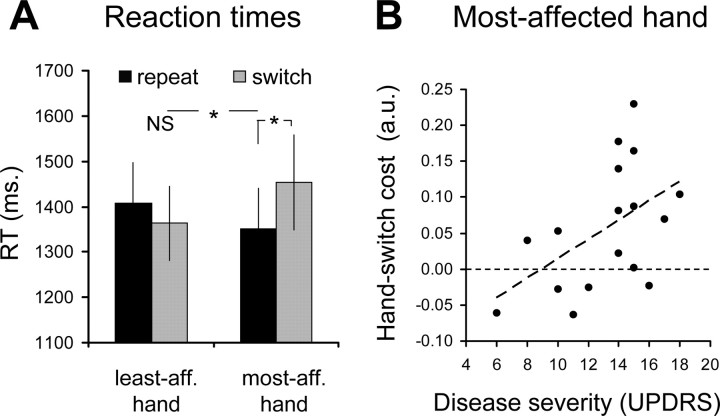
Figure 2.
Behavioral performance (experiment 1). The bars show the time that patients used to solve the hand-laterality judgment task (RT, in milliseconds; mean ± SEM). RTs for repeat (black bars) and switch trials (gray bars) are shown separately according to hand laterality (least affected, most affected). A shows RTs from 17 PD patients during fMRI scanning. B shows how the size of the behavioral switch cost for the most affected hand (on the y-axis, calculated as the difference between the averaged log-transformed RT for switch trials and repeat trials) increases linearly with disease severity (for the most affected side, on the x-axis). Each dot represents one patient. * and NS indicate statistically significant and nonsignificant effects, respectively.

