
Figure 4.
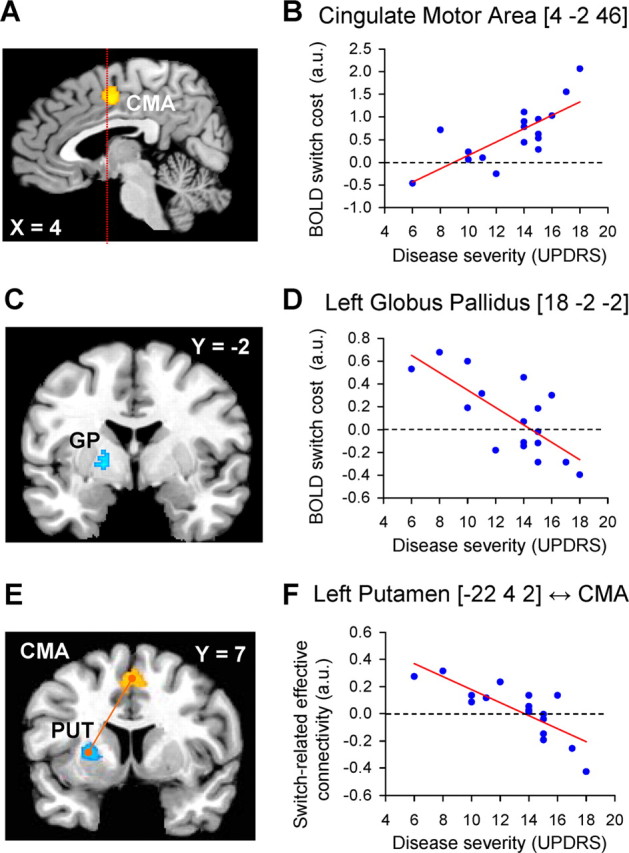
Correlation between cerebral effects and disease severity. A, C, E show the anatomical distribution of switch-related responses that were modulated by clinical disease severity. B, D, F show the relationship between switch-related activity and disease severity. Switch-related responses and disease severity are shown for the most affected side. A, B, Brain regions in which switch-related activity increased as a function of disease severity. C, D, Brain regions in which switch-related activity decreased as a function of disease severity. E, F show that switch-related interregional coupling between the CMA (E, in orange) and the left putamen/GP (E, in cyan) decreased as a function of disease severity. In B and D, each dot represents switch-related activity for one patient. In E, each dot represents the change in correlation between responses in the left putamen and the CMA during hand-switch trials (compared with hand-repeat trials) for one patient. The statistical parametric maps (A, C, E) represent the results of a random effects analysis, shown at an uncorrected threshold of p < 0.01 (for graphical purposes), and superimposed on sagittal and coronal sections of a representative brain of the Montreal Neurological Institute series. The left side of the figure shows the left side of the brain.