
Figure 2.
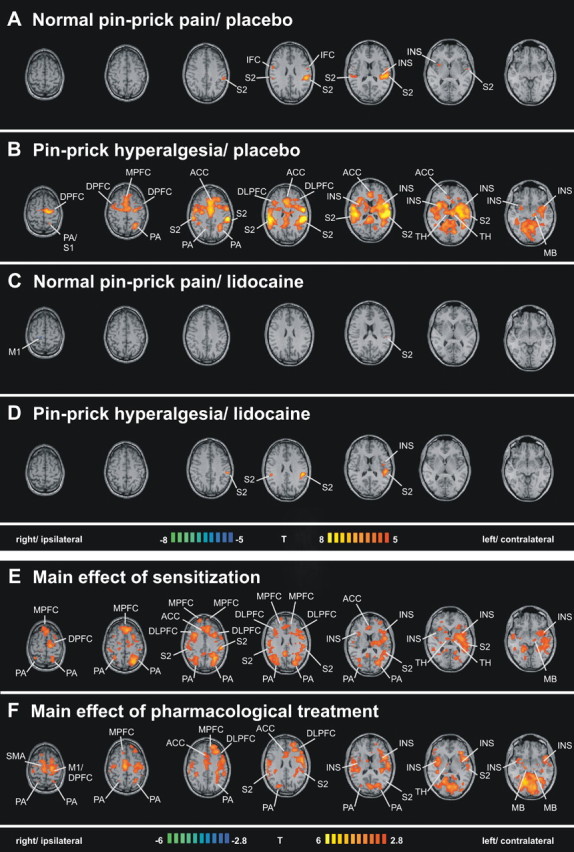
A–D, Regions of cerebral activations related to the tested conditions: normal pin-prick pain/placebo (A), pin-prick hyperalgesia/placebo (B), normal pin-prick pain/lidocaine (C), and pin-prick hyperalgesia/lidocaine (D). Group activations were registered onto a Talairach-transformed brain in axial view, thresholded at T >5, p < 0.025, corrected for multiple comparisons. E, F, Main effects of the factors sensitization and pharmacological treatment. The T-statistic contrast maps show the main effect of sensitization, averaged across both pharmacological treatment groups (E), and the main effect of pharmacological treatment, averaged across both sensitization states (F). Areas that are coded red/yellow in E showed a significantly greater response during the sensitized state compared with the nonsensitized state. Areas that are coded in red/yellow in F showed a significantly greater response to pin-prick stimuli during the placebo treatment compared with the lidocaine treatment. The group statistic contrast maps are registered onto a Talairach-transformed brain, thresholded at T >2.8, p < 0.005 uncorrected for multiple comparisons. The Talairach-coordinates, T-scores, Bonferroni-corrected p values and cluster sizes are depicted in Table 1. INS, Insula; M1, primary motor cortex; TH, thalamus; MB, midbrain.