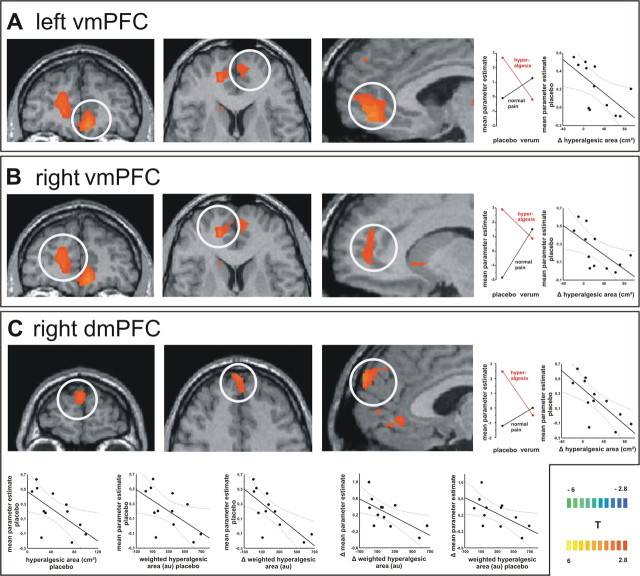
Figure 3.
A–C, Interaction contrast. The T-statistic contrast map shows interaction of the factors “sensitization” and “pharmacological treatment” in the subregions of the mPFC: A, left vmPFC; B, right vmPFC; and C, right dmPFC. The group statistic contrast maps are registered onto a Talairach-transformed brain, thresholded at T > 2.8, p < 0.005 uncorrected for multiple comparisons. The Talairach-coordinates and cluster sizes are depicted in Table 1. The mean parameter estimates of the four conditions reveal the nature of sensitization–treatment interaction: only pin-prick stimuli on sensitized skin lead to increased activation in those mPFC areas. Correlation analysis shows that the activity in the bilateral vmPFC correlated significantly inverse with the difference in the hyperalgesic area between placebo and lidocaine. The activity in the right dmPFC correlated significantly inverse with (1) the difference in hyperalgesic area between placebo and lidocaine, (2) the hyperalgesic area during placebo, (3) the weighted hyperalgesic area during placebo, and (4) the difference in weighted hyperalgesic area between placebo and lidocaine. Moreover, the difference in dmPFC BOLD response between placebo and lidocaine correlated significantly inverse with (1) the weighted hyperalgesic area during placebo and (2) the difference of weighted hyperalgesic area between placebo and lidocaine.

