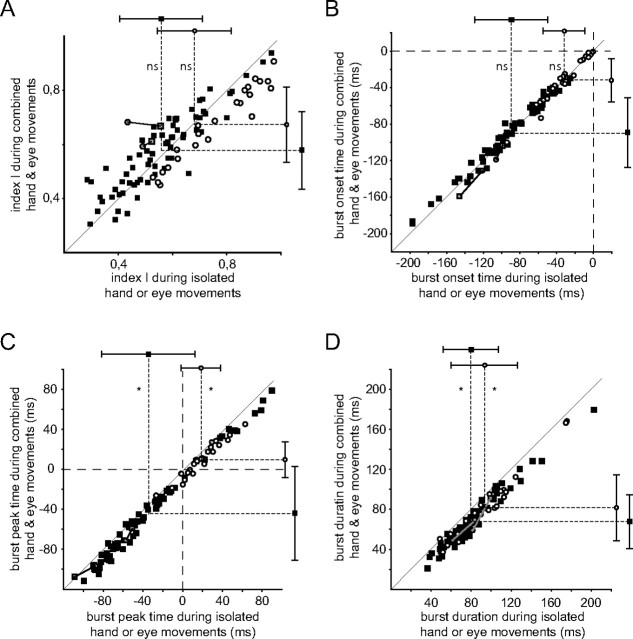
Figure 10.
Comparison of strength (A) and timing (B) of movement-related bursts evoked by isolated and combined eye and hand movements. A, Index Ichange of activity change relative to baseline for combined (y-axis) versus isolated (x-axis) movements. The data are aligned on the onset of the type of movement preferred by the respective neuron. Black squares depict HMR units, open circles SR units. The two neurons activated by both types of movement are plotted in gray, aligned either on hand movement onset (gray squares) or on saccade onset (gray circles); the two data points belonging to the same neuron are connected by a solid line. The symbols with whiskers above and right of the scatter plot indicate the mean and SDs of the SR and HMR neurons, respectively. In A and B, broken lines connecting both (marked with ns = nonsignificant) reflect the results from Bonferroni-corrected paired Student's t tests. B, Burst onset time for combined (y-axis) versus isolated (x-axis) movements, determined with respect to the onset of the respective preferred type of movement. C, Burst peak time with respect to movement onset for combined versus isolated movements. Broken lines in C and D marked with asterisks denote significant differences, p < 0.05. D, Burst duration for combined versus isolated movements. Notation is as in C.

