Figure 2.
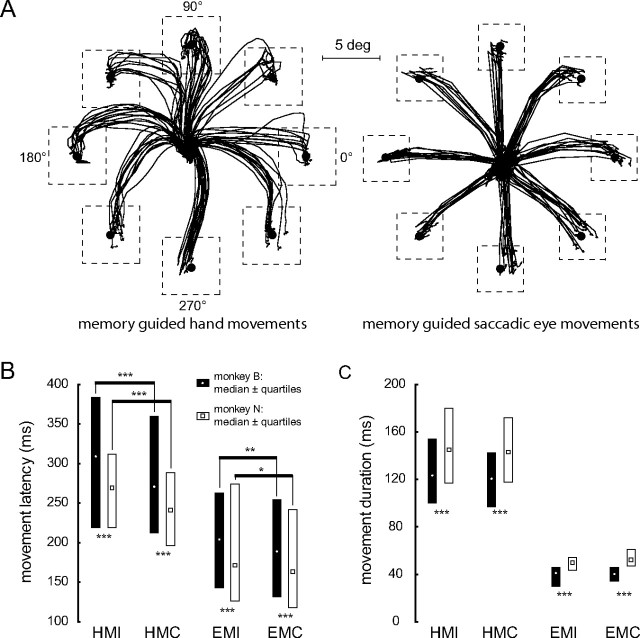
Behavioral data of the monkeys B and N. A, Movement trajectories (black lines) for memory-guided hand movements (left panel) and saccadic eye movements (right panel) from the central fixation point to the eight target positions (black circles), both in the frontoparallel plane of the CRT screen; the main axes are given with their corresponding movement angles. The boundaries of the control windows are depicted by the broken-line squares. B, Median latencies of the hand movements in the hand movement only (HMI = hand movement isolated) and the combined eye and hand movement (HMC = hand movement combined with eye movement) conditions as well as of the saccadic eye movements in the eye movement only (EMI = eye movement isolated) and the combined eye and hand movement (EMC = eye movement combined with hand movement) conditions. Medians of monkey B are given by open circles with black bars representing the range of the lower and upper quartile (interquartile range); medians of monkey N are indicated by open squares with interquartile ranges given by white bars. Asterisks below the bars give significance levels of Mann–Whitney U tests; asterisks above the bars give significance levels of Wilcoxon tests. C, Median movement duration ± interquartile range for both monkeys. Symbols are as in B; significance level for Mann–Whitney U tests: ***p < 0.001; significance level for Wilcoxon tests: *p < 0.05, **p < 0.01, ***p < 0.001.

