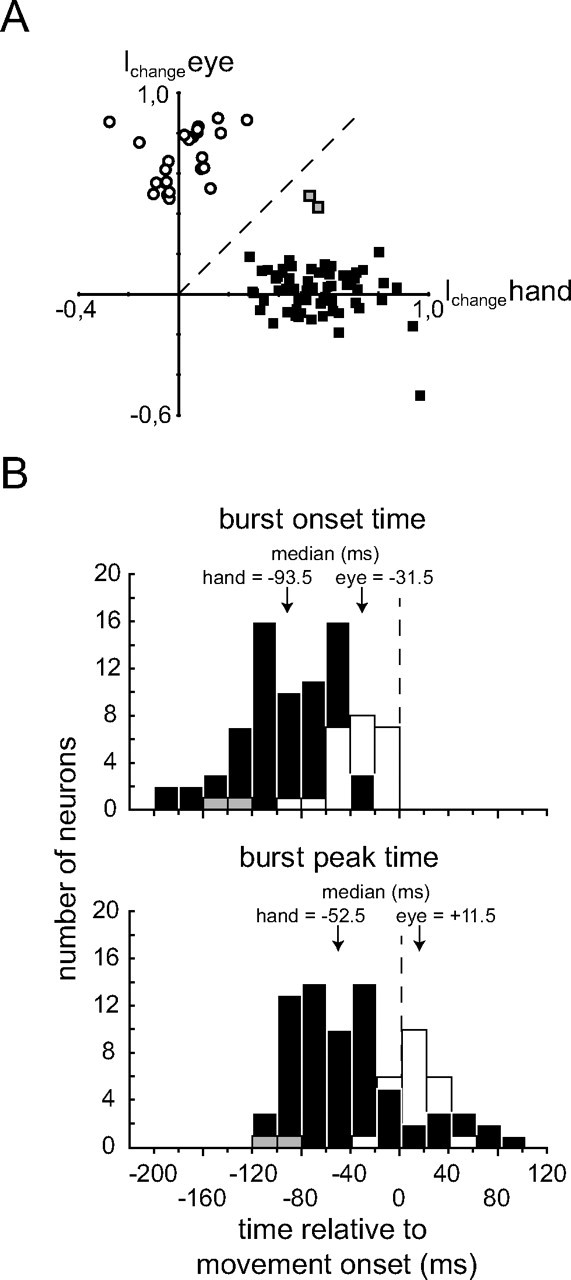
Figure 9.

Population data of eye and/or hand movement-related units. A, Plot of saccade-related responses (y-axis) as a function of hand movement-related responses (x-axis) based on the index Ichange capturing the change of spike rates relative to baseline levels during the burst intervals of saccadic eye movements (y-axis) versus the index for hand movements (x-axis) (see Materials and Methods). Negative values indicate a decrease of activity relative to baseline during the respective movement, whereas positive values reflect an increase of activity. Filled squares represent neurons that showed bursts for hand movements only, open circles those that responded to saccades only, and gray squares represent the two neurons responding to both types of movement. B, Histograms (bin width 10 ms) of burst onset (top) and burst peak time (bottom) relative to movement onset. Hand movement-related neurons are represented by black bars, saccade-related neurons by white bars, and the two neurons responding to both eye and hand movements by gray bars. The median latencies are given above the arrows.
