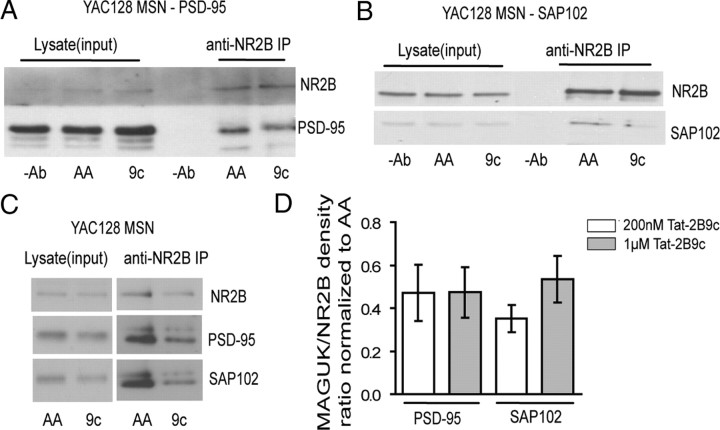
Figure 3.
Tat–NR2B9c (9c) disrupts coimmunoprecipitation of NR2B with PSD-95 and SAP102 in cultured MSNs. A, Representative blot showing that 1 μm Tat–NR2B9c disrupts co-IP of NR2B with PSD-95 in YAC128 cultured MSNs. B, Representative blot showing that 1 μm Tat–NR2B9c disrupts co-IP of NR2B with SAP102 in YAC128 cultured MSNs. C, Representative blot showing that 200 nm Tat–NR2B9c disrupts co-IP of NR2B with both PSD-95 and SAP102 in YAC128 cultured MSNs. A–C, The concentration of Tat–NR2BAA (AA) used in each experiment matched that of the Tat–NR2B9c (9c). D, The pooled data of the reduction of either PSD-95 or SAP102 (MAGUK) to NR2B band intensity ratio by both 200 nm and 1 μm Tat–NR2B9c concentrations (normalized to its paired Tat–NR2BAA at the same concentration as Tat–NR2B9c). For the four bars from left to right, *p < 0.05, n = 3; *p < 0.05, n = 8; *p < 0.05, n = 4; **p < 0.01, n = 3, compared with its paired Tat–NR2BAA at the same concentration (data not shown, all equal to 1), by paired one-sample t test, respectively.

