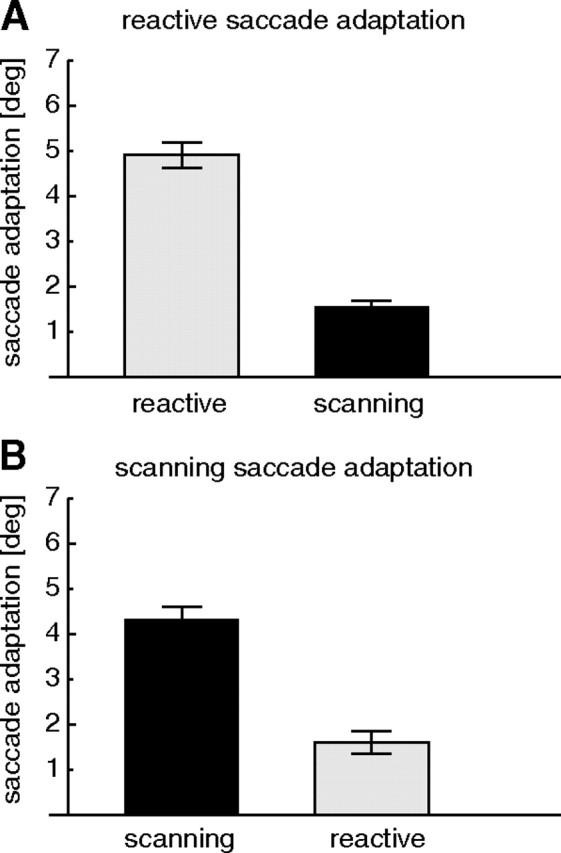
Figure 3.

A, Average amplitude reduction after reactive saccade adaptation for reactive saccades (gray) and for scanning saccades (black). B, Average amplitude reduction after scanning saccade adaptation for reactive saccades (gray) and for scanning saccades (black). In both cases, there is strong adaptation and small transfer to the other saccade type. Error bars are SEs.
