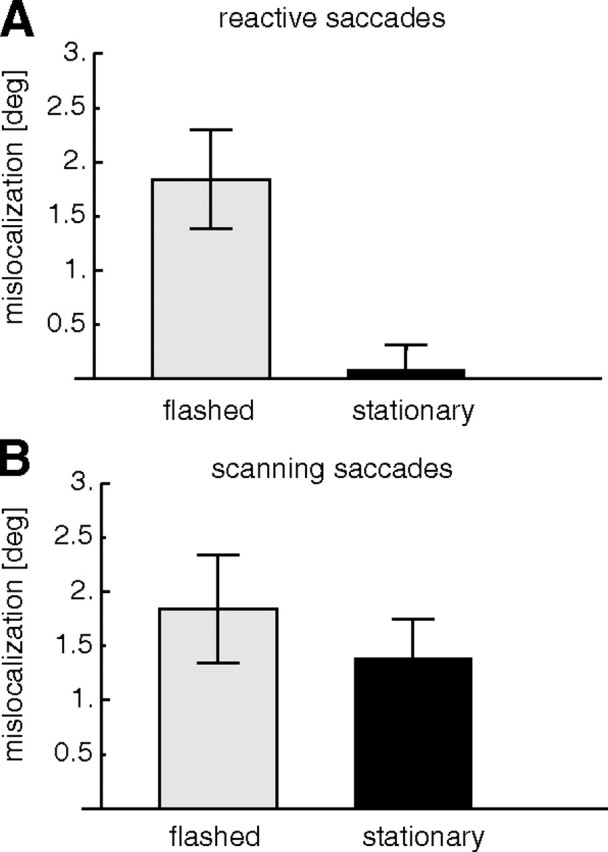
Figure 5.

Average mislocalization after saccade adaptation. Plotted on the ordinate is the difference between the localization before and after adaptation. A, Mislocalization of flashed (left) and stationary (right) probes after reactive saccade adaptation. B, Mislocalization of flashed (left) and stationary (right) probes after scanning saccade adaptation. All data are from trials in which the saccade target was turned off during execution of the saccade (target-off trials). Error bars are SEs.
