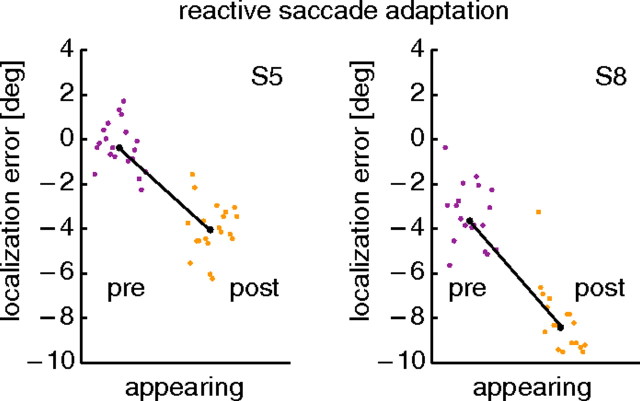
Figure 6.
Localization results from reactive saccade adaptation with appearing probes. Two subjects were tested, one of them the subject of Figure 4. The localization error plotted on the ordinate is the difference between true and perceived location of a probe stimulus. Each point is data from a single trial. In each subfigure, trials are arranged in the order in which they were conducted. Preadaptation data are plotted on the left, and postadaptation data are on the right. The black line connects the medians of both data sets.

