
Figure 3.
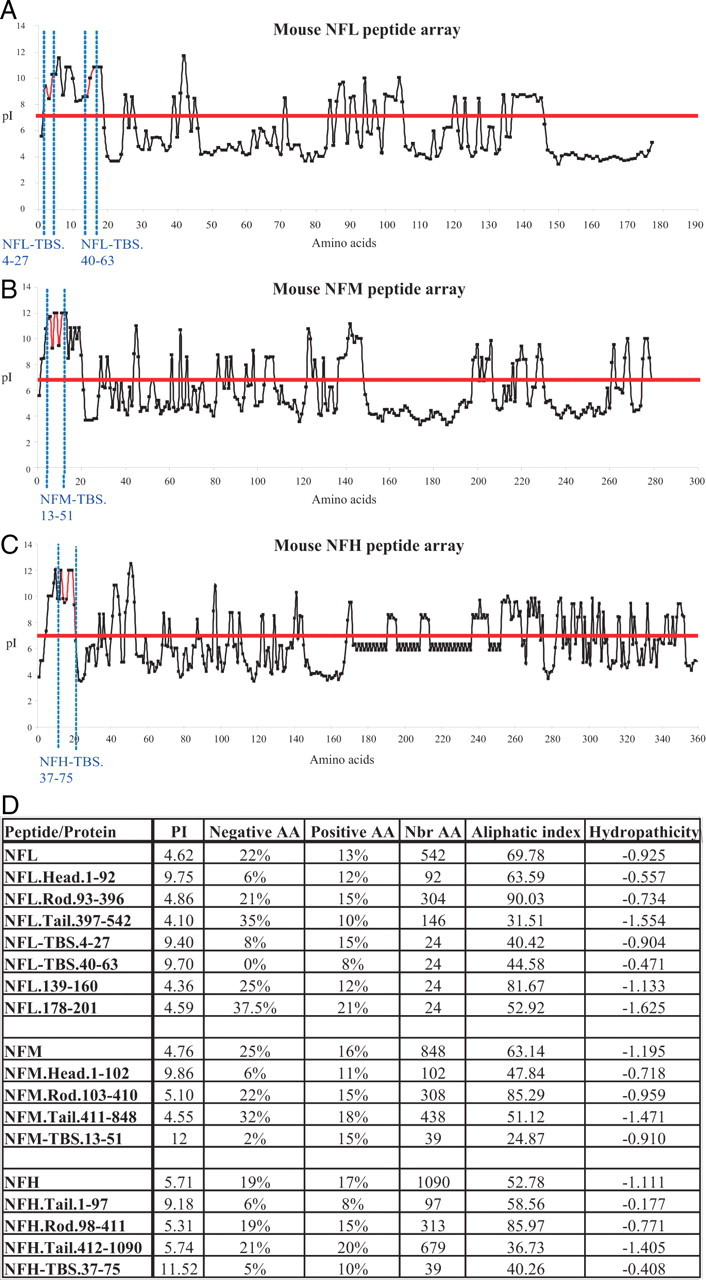
Calculation of the pI (isoelectric point) for each peptide spotted on the peptide arrays. A–C, The pI value was calculated for each 15-aa-long peptide present on the peptide array corresponding to NFL (A), NFM (B), and NFH (C). The graphs show that the pI of the TBS is slightly higher when compared with the rest of the sequence. However, some peptides have high pI values, but they do not bind tubulin. D, Several biochemical characteristics of each NF subunit and their intramolecular domains are summarized. Interestingly, the pI value of the “head” domain of each NF subunit is higher compared with the rest of the sequence. Calculations were performed online using “ProtParam tool” available at www.expasy.org.