
Figure 1.
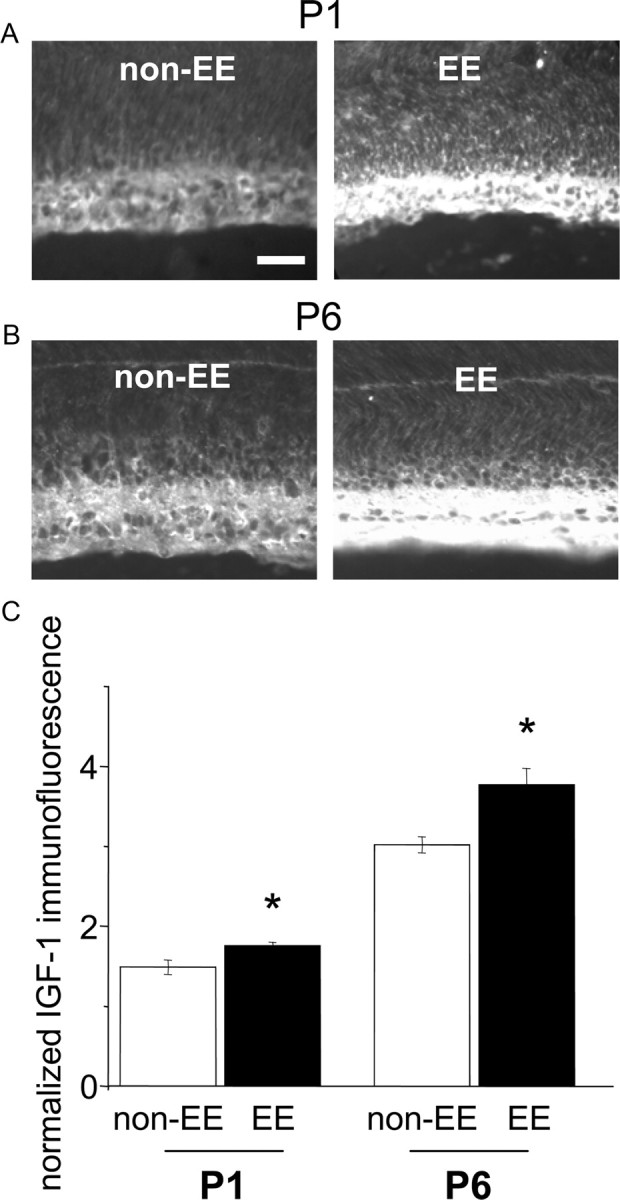
IGF-1 expression is enhanced in the RGC layer of EE pup retinas. Pregnant females were exposed to EE or non-EE, and the pups were examined at P1 and P6 for IGF-1 immunoreactivity. A, B, Representative images of P1 and P6 non-EE and EE pup retinas. Scale bar, 50 μm. C, Quantitative analysis of mean IGF-1 immunofluorescence intensity in the RGC layer normalized to mean background level in the ONL layer. Astrisks denote that the difference between normalized IGF-1 immunoreactivity in the RGC layer of EE and non-EE rats is statistically significant (P1, EE, 1.76 ± 0.04 vs non-EE, 1.49 ± 0.09; t test, p = 0.037; P6, EE, 3.77 ± 0.21 vs non-EE, 3.02 ± 0.1; t test, p = 0.019). Error bars represent SEM.