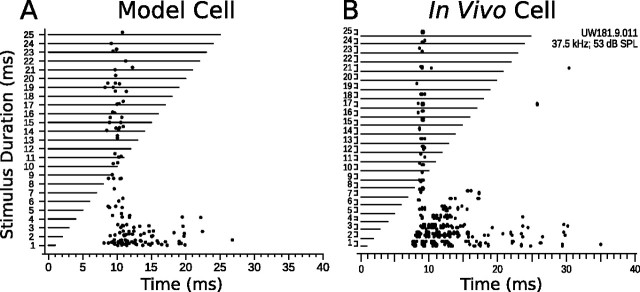
Figure 11.
Onset excitation breakthrough in model and in vivo DTNs. A, Dot raster display of an onset breakthrough response in a short-pass anti-coincidence model neuron (BD, 1 ms) with the SI to DTN connection weight decreased from −5 to −4.3 and the SI to DTN axonal delay increased from 1 to 2.8 ms (15 trials per stimulus; mean Poisson input firing rate, 400 Hz). B, Dot raster display of an onset breakthrough response in an in vivo short-pass DTN (BD, 1 ms; 15 trials per stimulus; 30 dB above threshold). B was reprinted with permission [Faure et al. (2003), their Fig. 6B].

