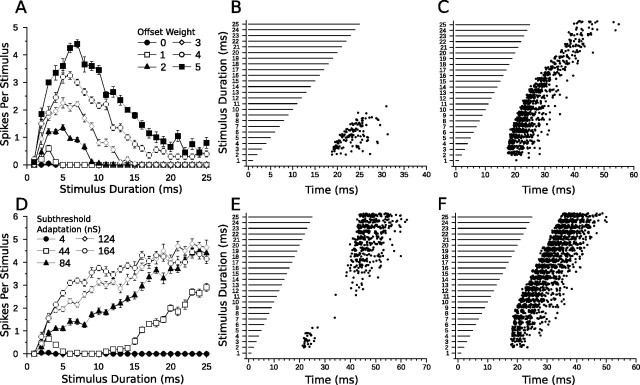
Figure 12.
Offset excitation in the bandpass coincidence detection model. A, Mean ± SE duration-tuning curves of a bandpass coincidence detection model cell with the OFF to DTN connection weight varied from 0 to 5 (Fig. 3A) and a mean Poisson input rate of 400 Hz (20 trials per stimulus). B, C, Dot raster displays showing responses of the bandpass coincidence model with the OFF to DTN connection weight set to 2 (B) and 5 (C). D, Mean ± SE duration-tuning curves of a bandpass coincidence model with postinhibitory rebound and increasing levels of subthreshold adaptation in the model neuron (see Results, Relevance of model components). E, F, Dot raster displays showing responses of the bandpass coincidence model with postinhibitory rebound and subthreshold adaptation levels of 44 nS (E) and 164 nS (F). In E, note the bimodal pattern of action potentials. The model cell reliably spiked in response to stimulus durations between 2 and 4 ms and at durations >15 ms. The band-reject selectivity resulted from the failure of the model cell to produce spikes from postinhibitory rebound at short durations unless the rebound coincided with the onset-evoked excitation; however, at longer durations, the rebound was strong and spikes were produced in the model DTN. In F, the high level of subthreshold adaptation allowed the model cell to spike via postinhibitory rebound at all but the shortest duration; hence the cell lost its duration selectivity.

