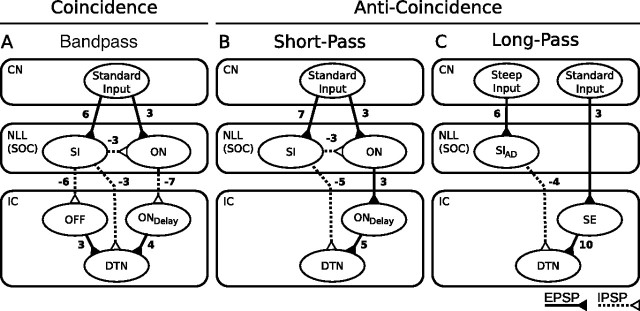
Figure 3.
Network flow diagrams for three computational models of duration tuning. The rectangles define nuclei of the mammalian central auditory system in which the proposed model components may exist in vivo. The solid lines with filled triangles connecting populations represent EPSPs, and the dashed lines with open triangles represent IPSPs, with connection weights as shown. The ovals represent subpopulations of neurons that share similar response characteristics. Standard Input, Acoustic input implemented as a Poisson spiking process in CN afferents (Fig. 2A); Steep Input, acoustic input to inhibitory components in the long-pass model implemented as a Poisson spiking process with a mean firing rate that grows steeply as stimulus intensity increases; SI, cells that provide sustained inhibition during a stimulus; ON, cells that respond with one or two spikes to stimulus onset; OFF, cells that respond with one or two spikes to stimulus offset via a postinhibitory rebound mechanism; ONdelay, onset cells that respond with one or two spikes after some delay; SIAD, cells that provide adapting sustained inhibition during a stimulus; SE, cells that provide sustained excitation during a stimulus. A, In the bandpass coincidence detection model, the DTN responds only when the stimulus duration results in the production of spikes in the ON cells and EPSPs from the ONdelay and OFF cells coincide. B, In the short-pass anti-coincidence model, the DTN responds only when the EPSP from the ONdelay cells does not coincide with the IPSP from the SI cells. C, In the long-pass anti-coincidence model, the DTN responds only when the EPSP from the SE cells is not suppressed by the adapting IPSP from the SIAD cells.

