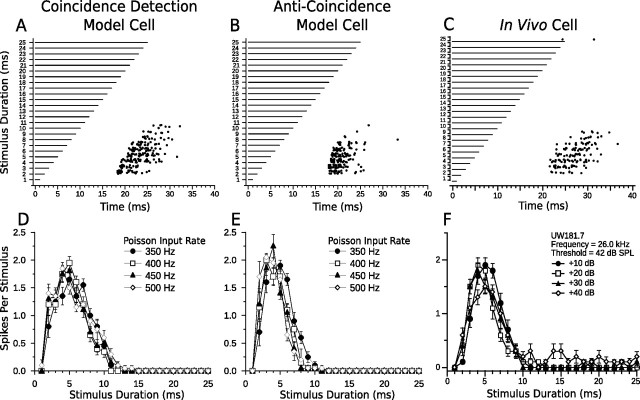
Figure 7.
Comparison of model and in vivo bandpass duration tuning. Shown are dot raster displays of the responses of a bandpass coincidence detection (A) and anti-coincidence (B) model cell to different stimulus durations (20 trials per stimulus; mean Poisson input firing rate, 400 Hz). Model cells have a BD of 5 ms. C, Dot raster display of the responses of an in vivo bandpass DTN with a BD of 5 ms to variable duration pure tones presented at the characteristic frequency of the cell (20 trials per stimulus; 30 dB above threshold). D–F, Mean ± SE spikes per stimulus as a function of stimulus duration (i.e., duration-tuning curves) at four different CN Poisson input firing rates (D, E) or different SPLs relative to threshold (F). Four different Poisson firing rates were chosen to be analogous to four different acoustic SPLs. Refer to Materials and Methods for additional details. Note the response tolerance to changes in stimulus magnitude in both model and in vivo cells. Coincidence detection model responses follow offset of the stimulus more faithfully than anti-coincidence model responses and have a slightly wider temporal bandwidth. C and F were reprinted with permission [Faure et al. (2003), their Fig. 4B].

