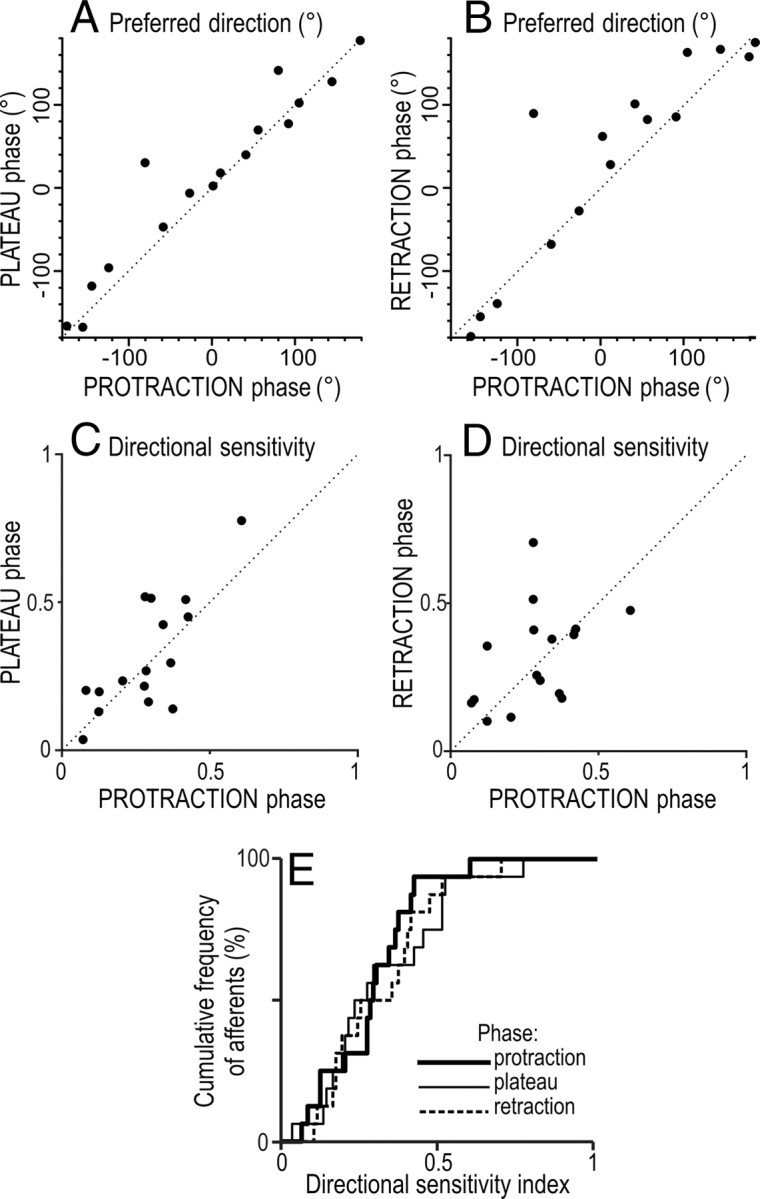
Figure 10.

Comparison of directionality of 16 SA-IInail afferents during different phases of the stimulus applied at 30° angle relative to normal. A, B, Relationship between preferred direction during the protraction phase and that during the plateau phase (raa = 0.73, p <0.01) and during the retraction phase (raa = 0.45, p <0.05). C, D, Relationship between the directional sensitivity indices during protraction versus the plateau phase (rs = 0.64, p <0.01) and versus the retraction phases (rs = 0.48, p = 0.06). E, Cumulative distribution of directional sensitivity indices during different phases of stimulation. A–D, The dotted line is a unity line showing equivalent preferred direction on the ordinate and abscissa. Polar coordinates as in Figures 1B and 4A.
