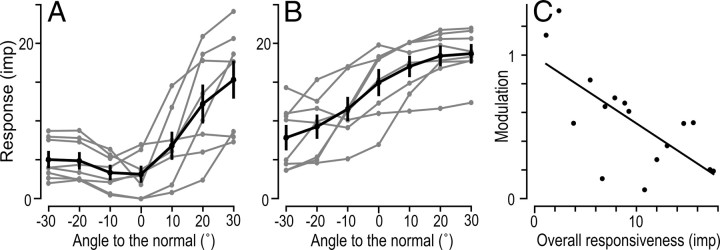
Figure 9.
Tuning curves illustrating the afferent's response as a function of direction of the force relative to the normal (0°) along the axis of the “least–most” preferred direction represented by −30 to 30°. A, B, Number of impulses elicited as a function of vertical force angle in relative to normal (vertical angle) for the eight afferents with the lowest overall responsiveness (A) and for the remaining eight afferents with higher overall responsiveness (B). The gray curves refer to single afferents and the black curve to means across afferents with vertical lines representing ± 1 SEM. C, Correlation between afferents' overall responsiveness and the modulation of their responses by direction of vertical force along the axis of the “least–most” preferred direction (rs = −0.63; p < 0.01). The modulation was computed as the ratio between the SD of the responses to stimuli with forces in all seven vertical angles and the mean response to stimuli in all seven angles (cf. coefficient of variation). Each symbol represents a single afferent and the line show the linear regression.

