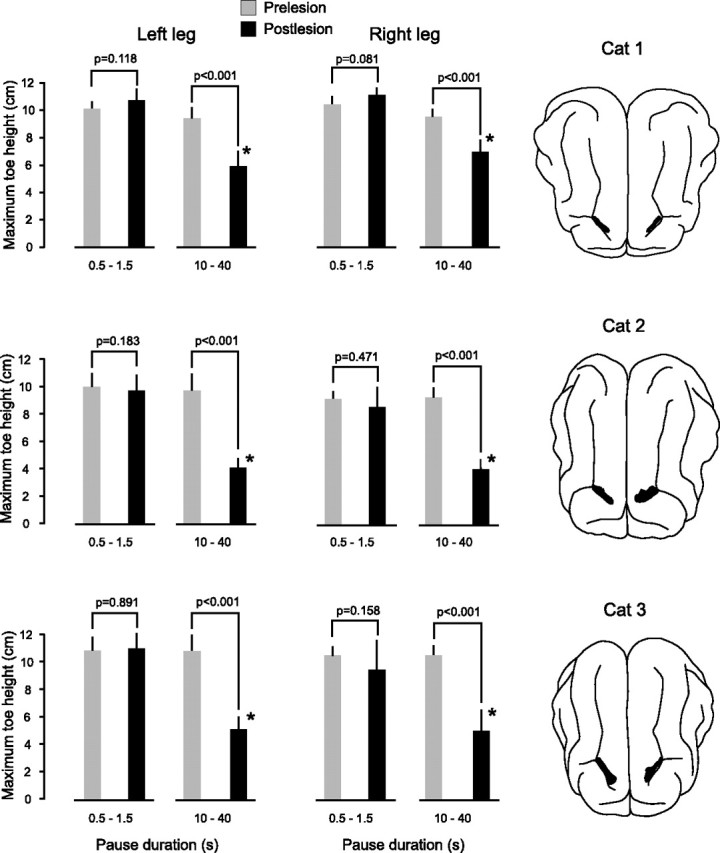
Figure 3.

Memory loss in the three animals with bilateral lesions of area 5. The bar plots show the mean values of maximum toe height in the left and right legs before (gray bars) and from 1 to 3 d after (black bars) the lesions for two ranges of pause durations, 0.5 to 1.5 s and 10 to 40 s. Error bars are SDs. Note that in all three animals there was a significant (*) reduction in maximum toe height after the lesions for pause durations greater that 10 s. There was no significant reduction in maximum toe height for short pause durations. The number of trials in each condition ranged from 4 to 23. The drawings of the right show the extent of the lesions (black-filled regions) in the posterior parietal cortex.
