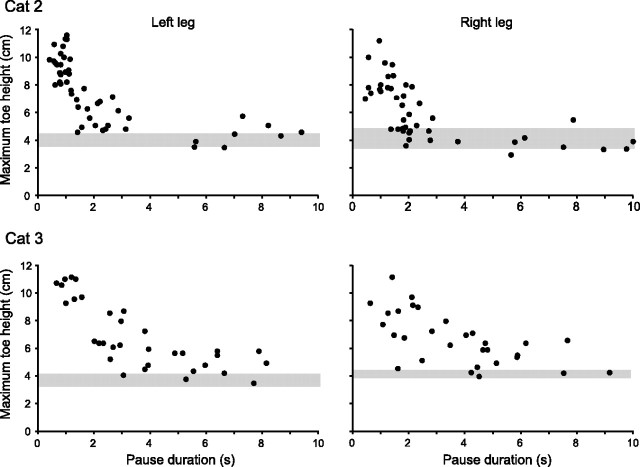
Figure 4.
Rapid loss of memory of obstacle height after bilateral lesions in area 5. Scatter plots of maximum toe height versus pause duration in the left and right legs of cat 2 (top) and cat 3 (bottom) after bilateral lesions in area 5. Note the rapid decline in maximum toe height as pause duration increased over the range of 0.5 to 3 s in cat 1 and 0.5 to 5 s in cat 2.

