Figure 3.

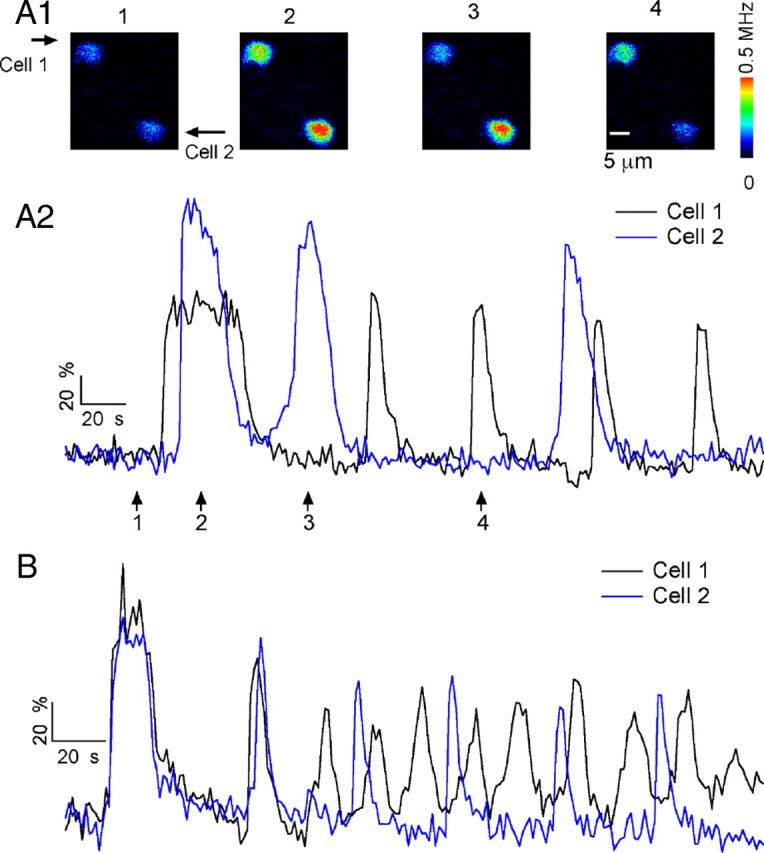
Oscillations recorded from pairs of adjacent MLIs. A1, Pseudocolor images from a pair of preloaded MLIs at rest (1) and at succeeding times during exposure to 2 μm quisqualate (2–4). A2, Time course of ΔF/Fo signals for the 2 MLIs that oscillate out of synchrony. The arrows indicate the time for the images shown in A1. B shows the ΔF/Fo time course from a different pair of MLIs. In this case, the fluorescent transients show evidence of synchronization.
