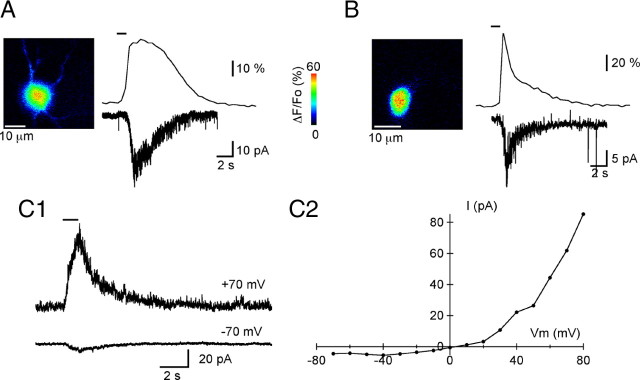
Figure 5.
Membrane currents induced by a group I mGluR agonist. A, Left, ΔF/Fo image of a portion of the somatodendritic compartment of an MLI at the peak of the response to a 1 s puff of the specific group I mGluR agonist DHPG (100 μm). Right, Time course of the agonist-induced ΔF/Fo signals and the corresponding membrane current. Membrane potential, −70 mV. DHPG was applied at the time indicated by the bar above the ΔF/Fo trace. B, In a different MLI, DHPG (100 μm) elicits a briefer ΔF/Fo signal that correlates with a shorter-lived membrane current. The left panel displays the ΔF/Fo image at the peak of the DHPG response for this MLI. C, Voltage dependence of the mGluR1-induced current: currents elicited by 100 μm DHPG in a MLI recorded with Cs methanesulfonate solutions are shown for two membrane potentials (C1). Note the strong outward rectification, evident in the current-to-voltage relation for this MLI (C2).

