Figure 6.
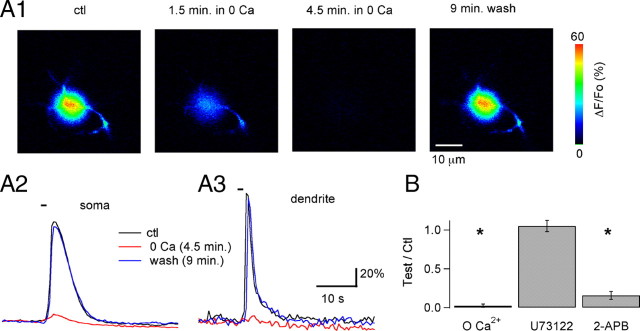
Pharmacological profile of the metabotropic Ca2+ transients. A1, ΔF/Fo images corresponding to the peak of the Ca2+ response to a 1 s puff of 100 μm DHPG in a preloaded MLI in control conditions (first panel), and at different times after the extracellular solution was changed to a Ca2+-free BBS containing 100 μm EGTA. The response disappears in the absence of extracellular Ca2+ and recovers when Ca2+ is reintroduced (last panel). A2 and A3 show the time course for the signals analyzed in the soma and in a dendritic ROI in the control period (black traces), 4.5 min after Ca2+ removal (red traces), and 9 min after Ca2+ readmission (blue traces). B, Pooled data on the effects of Ca2+ removal (n = 4; Ca2+ was removed 4–5 min before the test puff), U73122 (n = 5 with 5 min treatment at 2 μm), and 2-APB (n = 7 with 5–7 min treatment at 90 μm). The y-axis denotes the ratio between the peak ΔF/Fo responses to 1 s puffs of DHPG in the test condition over the value obtained in control for the same MLI. * indicates groups in which p was ≤0.05 using the paired Student's t test.

