Figure 7.
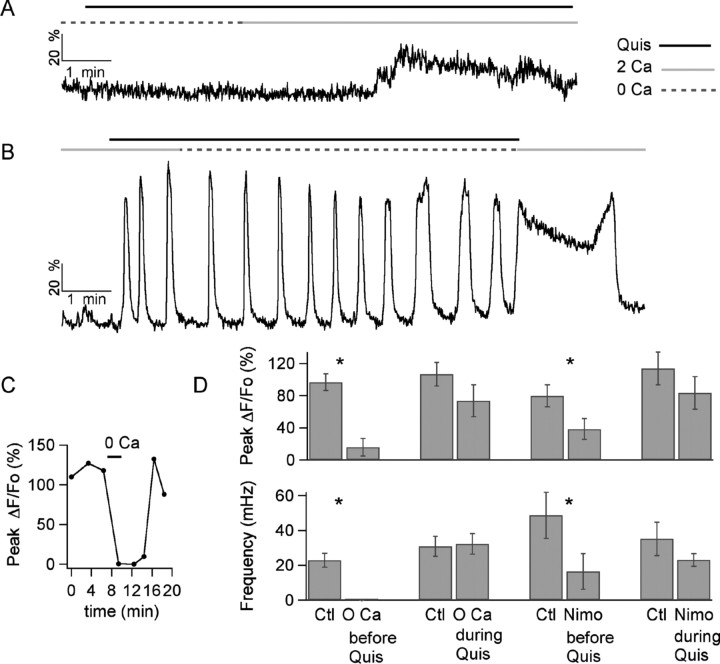
Effects of interfering with Ca2+ influx on the Ca2+ oscillations. A, In a preloaded MLI, a 2 μm quisqualate bath applied during the time indicated by the black bar above the trace fails to elicit any change in Ca2+ when extracellular Ca2+ is absent (as indicated by the discontinuous gray bar above the trace). A small response to the agonist develops within 2.5 min after Ca2+ is readmitted (as indicated by the gray solid bar above the traces). B, In a different MLI, in which the oscillatory response to quisqualate is initiated in the presence of Ca2+, removal of this cation does not stop the oscillations. When the agonist is removed and Ca2+ is readmitted, there is a 2-min-long Ca2+ plateau. C, Time course for the effects of extracellular Ca2+ removal (during the bar above the data points) on the peak ΔF/Fo rises obtained from a MLI dendrite on direct extracellular stimulation of the dendrite. The MLI is the same as used for the experiment shown in B. D, Pooled data from preloaded MLIs on the effects of Ca2+ removal and of block of L-type channels by 20 μm nimodipine (Nimo). Data were analyzed in terms of the peak of the ΔF/Fo signals induced by quisqualate (top) and their oscillation frequency (bottom). The notation “before Quis” refers to experiments in which Ca2+ removal or nimodipine treatment were started 5 min before quisqualate was applied (example in A). The notation “during Quis” refers to experiments in which Ca2+ removal or nimodipine treatment was performed during the oscillatory response (example in B). In the “during Quis” condition, peak ΔF/Fo values were measured 3–5 min after Ca2+ removal or nimodipine treatment, and the frequency of oscillations was calculated from the ensuing 2–3 min of recording. n = 4 for groups Ctl vs 0 Ca before Quis and Ctl vs Nimo before Quis, and n = 6 for the Ctl vs 0 Ca during Quis and the Ctl vs Nimo during Quis groups. * indicates groups in which p was ≤0.05 using the paired Student's t test.

