Figure 8.
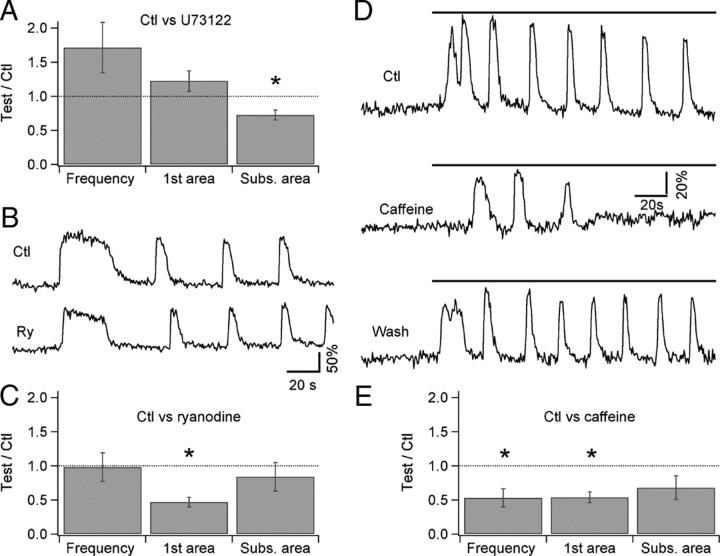
Pharmacological manipulation of InsP3 and ryanodine receptor signaling disturbs the Ca2+ oscillations. A, Pooled data (n = 4) for the effect of the phospholipase C inhibitor U73122 on quisqualate-evoked Ca2+ oscillations in preloaded MLIs. For each MLI, the responses to bath-applied 2 μm quisqualate were analyzed in the control condition and 10 min after adding U73122 (2 μm) to the bath perfusion solution. The treatment did not significantly affect the oscillation frequency or the area under the first Ca2+ transient (first area), but it decreased the area under the subsequent oscillations (Subs. area). B, Oscillatory Ca2+ signals in a preloaded MLI in control condition (top) and 10 min after addition of 100 μm ryanodine to the bath perfusion solution (bottom). C, Pooled data (n = 6) for the effects of ryanodine on quisqualate-evoked Ca2+ oscillations in preloaded MLIs. For each MLI, the responses to bath-applied 2 μm quisqualate were analyzed in the control condition and 10–12 min after ryanodine treatment. Block of RyRs did not affect the oscillation frequency, but it significantly decreased the area under the first transient. D, Oscillatory Ca2+ signals in a preloaded MLI in the control condition (top), 5 min after addition of 10 mm caffeine to the bath perfusion solution (middle), and 10 min after washing out the caffeine (bottom). E, Pooled data (n = 10) for the effects of caffeine on quisqualate-evoked Ca2+ oscillations in preloaded MLIs. For each MLI, the responses to bath-applied 2 μm quisqualate were analyzed in the control condition and 4–5 min after caffeine treatment. Caffeine drastically reduced the oscillation frequency as well as the amplitude of the response, as indicated by the decrease in areas for both the first transient (first area) and the subsequent oscillations (Subs. area). In A, C, and E, oscillation parameters are expressed as the ratio between the value in the test condition over the value obtained in control saline for the same MLI. * indicates groups in which p was ≤0.05 using the paired Student's t test.

