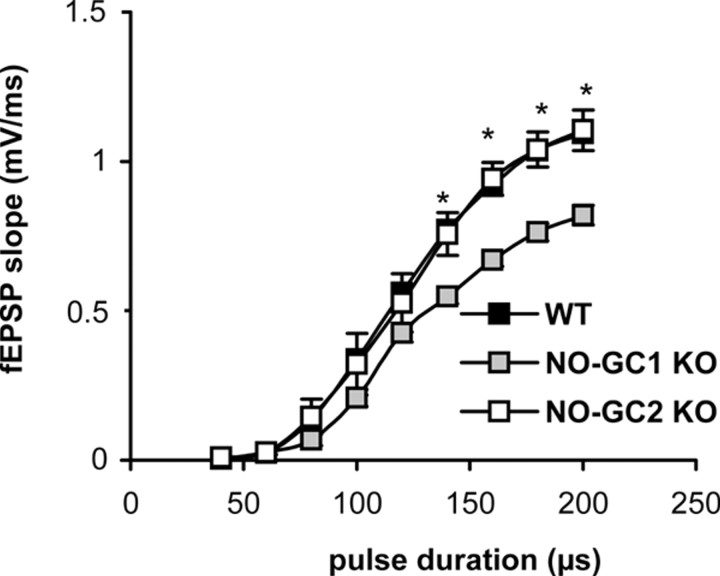
Figure 1.
Input–output curves of KO and WT slices. Shown are slopes of fEPSPs recorded in CA1 region of hippocampal slices from NO-GC1 KOs (8 slices from 4 mice, 4 female), NO-GC2 KOs (12 slices from 4 mice, 1 male and 3 female), and WT (11 slices from 6 mice, 2 male and 4 female), as described in Materials and Methods, in response to stimulation of afferent fibers projecting to the CA1 area. *p < 0.05, differences considered significant.

