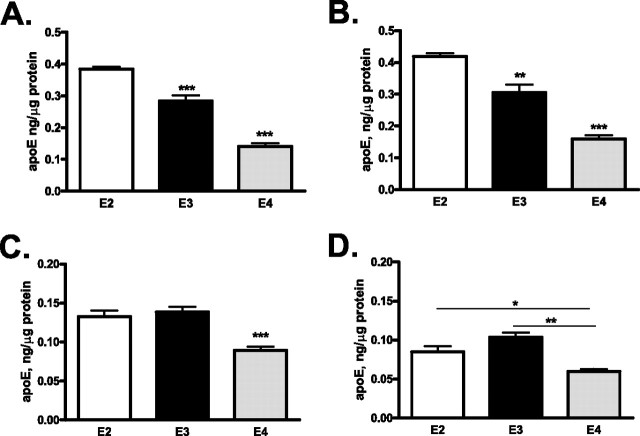
Figure 2.
A–D, Levels of apoE in brain homogenates from mice expressing human apoE2, 3, or 4 (E2, E3, or E4; 3 months of age) only. A, B, Soluble levels of apoE in hippocampal (A) or cortical (B) homogenates were significantly greater in TRE2 mice, whereas the levels of soluble apoE were significantly lower in TRE4 mice. C, D, Insoluble levels of apoE measured in the hippocampus (C) or cortex (D) were significantly lower in TRE4 mice. A–C, ***p < 0.001, **p < 0.01 versus all other groups ANOVA, Tukey–Kramer post test. D, **p < 0.05, *p < 0.01 t test.

