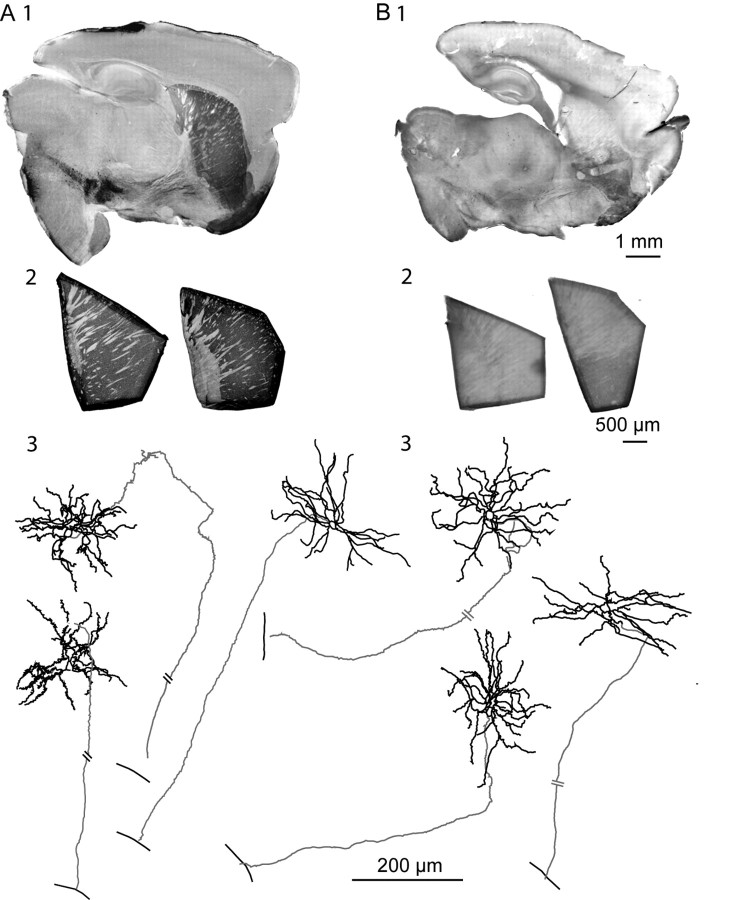
Figure 1.
Extent of DA depletion in the striatum and identification of the recorded MSNs. TH immunohistochemistry of adult BGS (1) and isolated striatum (2) from control (A) and DA-depleted (B) mice. The striatum was isolated from the corresponding BGS before the recording session. Note the absence of dark TH labeling in the BGS (B1) and in the two isolated striatum (B2) from 6-OHDA-treated mice compared with the corresponding control ones (A1, A2). Neurolucida reconstruction of biocytin-filled MSNs recorded in control (A3) and DA-depleted (B3) isolated striatum is shown. Somas and dendritic trees are in black and axons are in gray. The single bars crossing the axons indicate GP boundary; the double bars indicate interruption in the drawing because of the length of the axon.

