
Figure 3.
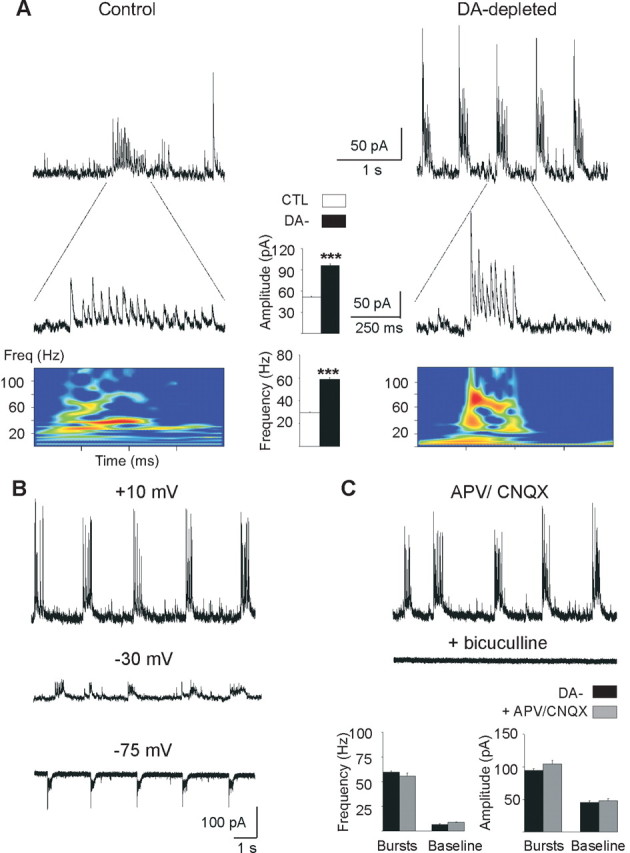
Burst characteristics. A, Whole-cell recordings (VH = +10 mV) of rare bursts (A) and recurrent bursts (B) of GABAA sPSCs in control (left) and DA-depleted (right) MSNs and corresponding power spectrum analysis of a single burst. Intraburst frequency of GABAA sPSCs are visualized by time–frequency representations (bottom colored diagrams) that enables determining the implication of different frequency ranges within the burst. The field power is here coded in colors so that red corresponds to higher amplitudes. The calibrations are identical for the left and right traces. Histograms in the center, Mean intraburst amplitude and frequency of GABAA sPSCs in control MSNs (□) and in DA-depleted MSNs with an oscillatory pattern (■). B, Recordings of recurrent bursts in a DA-depleted MSN at the indicated holding potentials (whole-cell configuration, internal CsGlu). C, Application of APV (40 μm) plus CNQX (10 μm) at VH = +10 mV did not significantly affect the frequency and amplitude of bursts or baseline events (bottom histograms), whereas bicuculline at 20 μm totally abolished them. Error bars indicate SEM. ***p < 0.001.