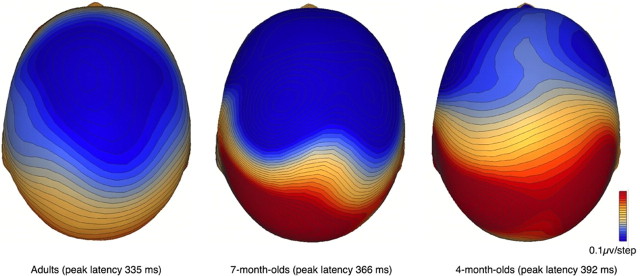
Figure 4.
Scalp distribution of MMN in adults, 7-month-old infants and 4-month-old infants. Isovoltage contour maps at the peak of the MMN response show a frontal negativity and posterior positivity in all three age groups, consistent with generators around the Sylvian fissure in left and right auditory cortices. However, with increasing age the negativity becomes more central in focus, and the clear bihemisphere pattern less distinct. This suggests that the orientation of the neurons contributing to the response changes somewhat with development.

