
Figure 2.
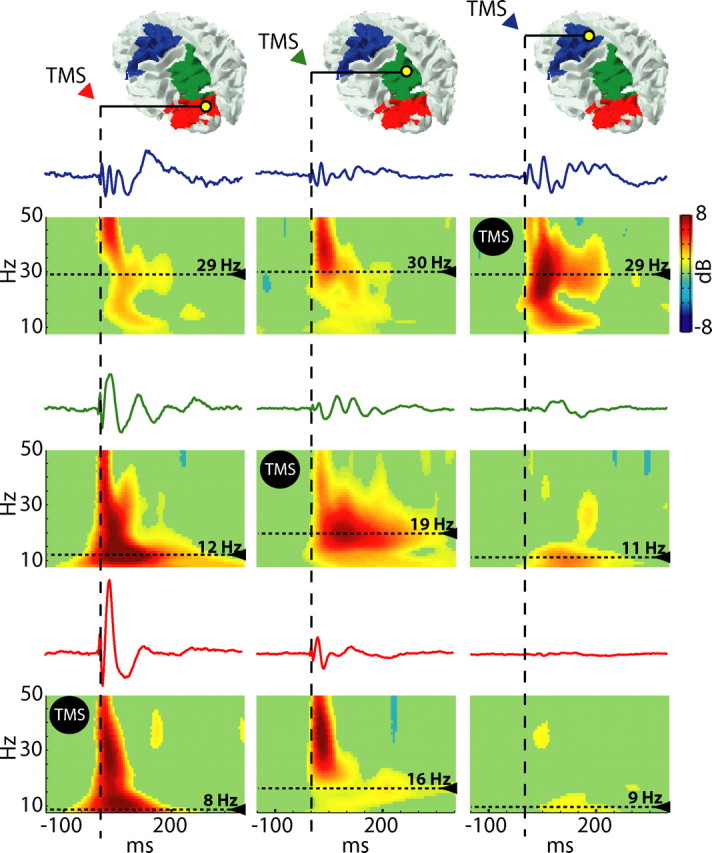
The natural frequency is a local property of individual corticothalamic modules. The colored patches on the cortical surface mark the areas from which cortical currents are recorded after source modeling. Below, time series and ERSP plots of local cortical currents are displayed for area 6 (first row, blue traces), area 7 (second row, green traces), and area 19 (third row, red traces), when area 19 is stimulated (first column), area 7 is stimulated (second column) and area 6 is stimulated (third column). The dotted lines highlight the peak frequency for each plot. Comparing the plots on the diagonal line marked by TMS icon reveals that each cortical area responds with a distinctive natural frequency when directly stimulated. Comparing the plots on the horizontal and on the vertical lines reveals that the natural frequency is a local property that is partially preserved also when its cortical generator is not directly stimulated.