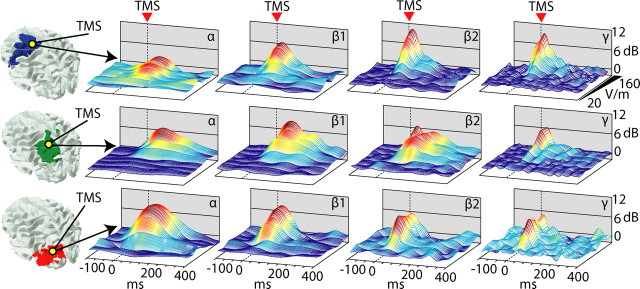
Figure 3.
Different natural frequencies, in different cortical areas, are not attributable to different stimulation intensities. Time series (ERSP) of standard EEG frequency bands (α, 8–12; β1, 13–20; β2, 21–29; γ, 30–50) for the three sites of stimulation (first row, area 6; second row, area 7; third row, area 19) are plotted as a function of stimulation intensity, ranging from 20 to 160 V/m. The specificity of the natural frequency is preserved also when stimulation intensity approaches the saturation level.

