
Figure 4.
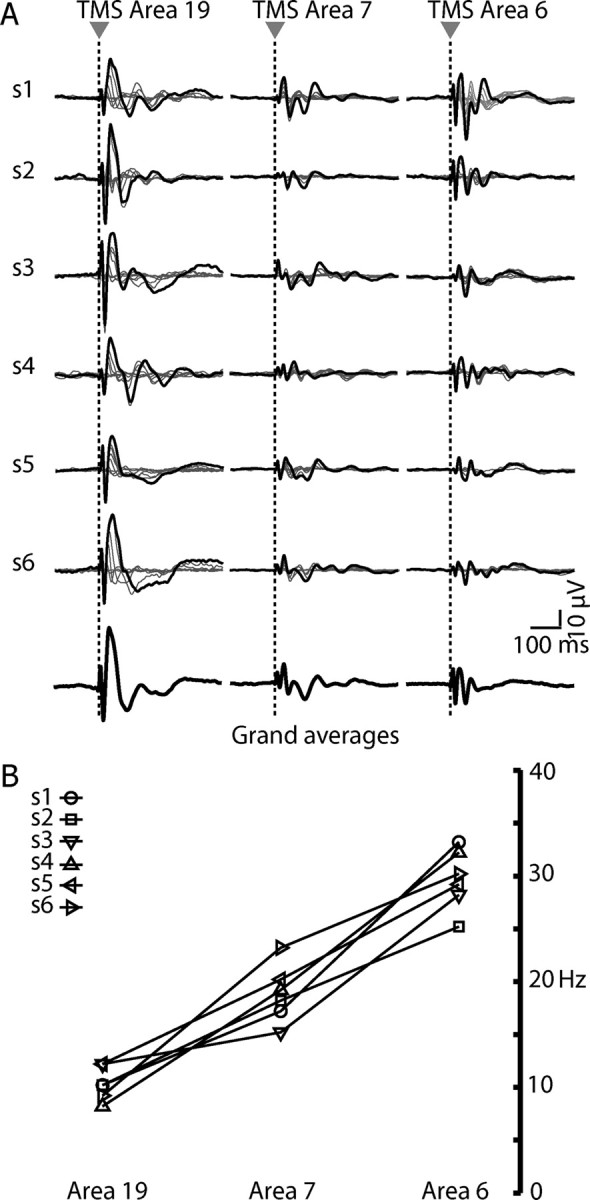
The specificity of the natural frequency is reproducible across subjects. A, The traces represent TMS responses for each subject (n = 6) evoked by 6–8 intensities of stimulation, recorded from one electrode underlying the stimulator. The black trace highlights the response obtained at maximal stimulation intensity (160 V/m). The thicker black traces at the bottom represent the grand averages calculated from all six subjects. B, The frequencies with maximum power, obtained by stimulating each cortical area at the maximal intensity, are plotted for each subject. A clear posterior–anterior gradient of increasing frequencies is observable.