Figure 5.
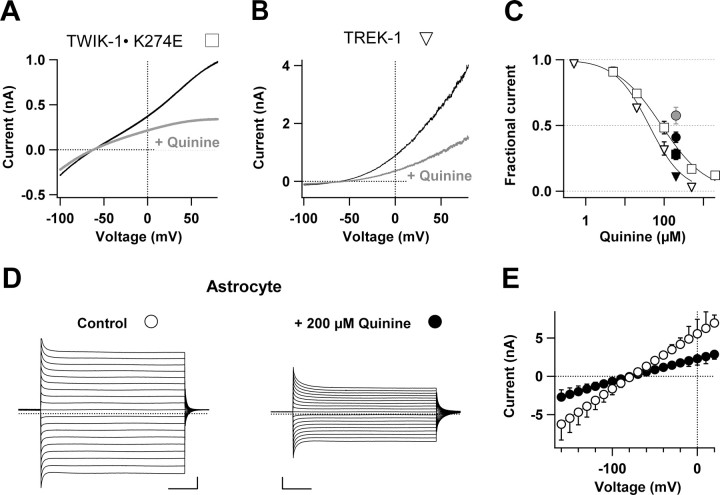
The sensitivity of astrocyte passive conductance and cloned TWIK-1 and TREK-1 K+ channels to quinine. A, B, Representative whole-cell current traces recorded from CHO cells expressing TWIK-1 (A) or TREK-1 (B) K+ channels induced by voltage ramp pulses before (black traces) and after (gray traces) application of 100 μm quinine. After washout of quinine, the traces were the same as control traces. C, The dose–response curves of the quinine blockage on TWIK-1 (open triangles) and TREK-1 (filled triangles) channels. The continuous lines were fitted according to Equation 3 that yielded IC50 values of 41.4 ± 4.8 μm and 85.4 ± 9.7 μm and h values of 0.98 and 0.77 for TREK-1 and TWIK-1, respectively (n = 5–6 for each data point). D, Representative astrocyte whole-cell passive currents recorded first in aCSF and then after addition of 200 μm quinine. The voltage pulse protocol was the same as in Figure 2. Calibration: 5 ms, 2 nA. E, The mean current–voltage relationship shows that 200 μm quinine (filled circles) inhibited 58% of passive conductance at the command voltages of +20 mV and −160 mV (also presented as filled circle in C, n = 5). Quinine (200 μm) similarly inhibited Cs+-mediated TWIK-1, TREK-1, and astrocyte passive conductances by 72.0% (filled square, n = 3), 88.0% (filled triangle, n = 4), and 42.5% (gray circle, n = 4), respectively (C).

