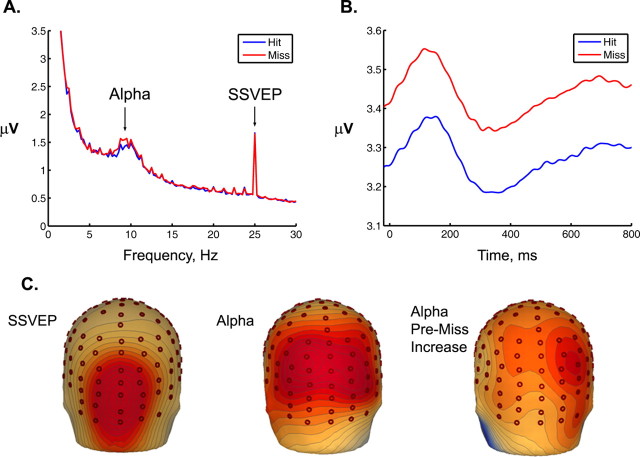
Figure 4.
A, The continuous EEG amplitude spectrum calculated over occipital scalp sites for the 4 s period preceding a target. Amplitude differences before hits and misses are highlighted for α (8–14 Hz) and SSVEP (25 Hz). Relative to misses, hits were associated with reduced α before a target, but there were no differences in SSVEP amplitude, again suggesting that basic visual processing of the stimuli was matched across the two detection conditions. B, Grand-average temporal spectral evolution of α activity calculated for the five standard frames immediately preceding the target interval. The hit vs miss differential was evident across the entire epoch, and no systematic differences time-locked to stimulus onset were apparent. C, Scalp topographies for distribution of SSVEP and α activity as measured in the 4 s spectrum. The “SSVEP” and “alpha” topographies map spectral amplitude preceding hits. The “alpha pre-miss increase” topography was generated using a normalized measure [miss − hit]/[miss + hit]. The increase in α power before a miss was most prominent over right inferior parietal scalp sites and was clearly distinct from the central occipital SSVEP topography associated with basic visual processing.

